Polycrystalline Solar Panels Pros, Cons and Use Cases
Polycrystalline silicon has a cost that is 10%-15% lower (industry estimates), a mass production efficiency of 18%-20% (NREL), and a low light output that is 5%-8% lower. It is used in distributed rooftops and rural power stations (Shandong agricultural photovoltaic case shows a cost reduction of 20%).
Pros
The main advantages of polycrystalline silicon solar panels lie in their excellent cost-effectiveness and proven reliability.
Their cost per watt is typically 20% to 30% lower than monocrystalline panels, allowing for the installation of a larger system capacity under the same budget.
The conversion efficiency of standard polycrystalline panels ranges between 15% and 17%, sufficient to meet the energy needs of most residential and commercial projects.
Good Temperature Coefficient
Why does temperature affect power generation efficiency?
The electrical properties of semiconductor materials are sensitive to temperature. When the temperature rises, the thermal vibration of the silicon atomic lattice intensifies, which increases the probability that photogenerated carriers (electrons and holes) will be scattered and recombine, thereby dissipating energy as heat instead of forming an electric current.
l Significant drop in open-circuit voltage (Voc): An increase in temperature causes the intrinsic carrier concentration of the semiconductor material to increase, leading to a decrease in the built-in potential of the PN junction, directly manifested as a drop in open-circuit voltage. The drop in voltage has a decisive impact on power because Power (P) = Voltage (V) x Current (I).
l Slight increase in short-circuit current (Isc): At the same time, the bandgap of silicon slightly narrows as the temperature rises, allowing it to absorb light of more wavelengths, causing a slight increase in short-circuit current. However, this gain is far from enough to compensate for the loss caused by the voltage drop.
l The net effect is a decrease in power: The magnitude of the voltage drop is much greater than the slight increase in current, so the final result is that the peak output power of the panel decreases as the temperature increases.
Comparison of Temperature Coefficients: Polycrystalline vs. Monocrystalline Silicon
Data shows that there are subtle but noteworthy differences in the temperature coefficients of polycrystalline and monocrystalline silicon cells.
Cell Type | Typical Peak Power Temperature Coefficient Range | Typical Open-Circuit Voltage Temperature Coefficient Range |
Polycrystalline Silicon Cell | -0.40% / C to -0.35% / C | -0.30% / C to -0.25% / C |
Monocrystalline Silicon Cell (PERC) | -0.35% / C to -0.30% / C | -0.27% / C to -0.23% / C |
Generally speaking, monocrystalline PERC cells have a slightly better temperature coefficient than conventional polycrystalline silicon cells, with an advantage of about 0.05%/°C.
Difference between laboratory data and real-world performance
The temperature coefficient given by the laboratory is measured under strictly controlled conditions (e.g., 1000W/m² irradiance). However, the situation is more complex in actual installations.
l Cell operating temperature: On a clear summer day, when the ambient temperature reaches 35°C, the actual temperature of rooftop solar panels can easily rise above 65°C. The panel's operating temperature is 40°C higher than the Standard Test Conditions.
l Calculating power loss:
l For a polycrystalline panel with a temperature coefficient of -0.37%/°C: Power loss = 40°C * 0.37%/°C = 14.8%
l For a monocrystalline panel with a temperature coefficient of -0.32%/°C: Power loss = 40°C * 0.32%/°C = 12.8%
l Offset of efficiency difference: Under standard conditions at 25°C, a monocrystalline panel with 21% efficiency has about 20% higher power output than a polycrystalline panel with 17.5% efficiency. However, at a high temperature of 65°C, the actual output difference between the two narrows. Although the monocrystalline panel still has higher absolute power, its efficiency advantage relative to the polycrystalline panel is partially diminished.
Impact of different technologies on the temperature coefficient
The design of the cell structure affects its performance at high temperatures.
l PERC technology: PERC cells with a rear passivation layer have a higher open-circuit voltage, which usually also makes them more sensitive to temperature, meaning the absolute value of the voltage temperature coefficient may be slightly larger. However, advanced passivation technology also improves carrier collection efficiency, partially offsetting this sensitivity. Therefore, the temperature coefficient of modern polycrystalline PERC cells can be very close to that of conventional monocrystalline cells.
l Cell color and heat dissipation: Typically, polycrystalline panels with blue silicon nitride anti-reflection coating reflect more light (especially infrared) than black-appearing monocrystalline panels, theoretically absorbing slightly less heat.
Sustainability Advantages
Energy Consumption and Recycling
Solar panel manufacturing is energy-intensive, but the clean energy generated during its operation far exceeds the energy required for manufacturing.
l Energy Payback Time (EPBT): According to data from the US National Renewable Energy Laboratory (NREL), the EPBT for modern polycrystalline silicon PV systems has been shortened to between 0.8 and 1.3 years.
l Relationship between silicon purity requirements and energy consumption: The silicon material required for manufacturing semiconductor-grade or monocrystalline silicon requires a purity of over 99.9999999% (9N), while the purity requirement for solar-grade polysilicon is 99.9999% (6N).
l Internal recycling of production waste: The recovery rate of silicon powder (silicon mud) generated during the silicon ingot cutting process exceeds 90%.
Material Utilization and Circular Economy
The polycrystalline silicon technology path itself is more inclined to reduce material waste.
l Silicon ingot yield rate: The yield rate (i.e., the ratio of the final usable ingot weight to the input silicon material weight) for producing polycrystalline silicon ingots by the directional solidification method typically exceeds 85%.
l Use of downgraded silicon material: The polycrystalline silicon casting process has higher tolerance for metal impurities, so it can incorporate a certain proportion of "downgraded silicon material" from the semiconductor industry or the silicon material production process that fails to meet higher purity standards.
l Recyclability of module materials: The weight composition of a standard solar panel is approximately: glass 70%, aluminum frame 18%, silicon cells 4.5%, polymer backsheet/encapsulant 7.5%. Currently, mature commercial recycling processes can efficiently separate and recycle glass and aluminum frames, with recovery rates exceeding 95%.
Carbon Emission Intensity Comparison
Life Cycle Assessment (LCA) is a tool for quantifying a product's carbon footprint. The carbon emission intensity of PV modules is measured in "grams of carbon dioxide equivalent per kilowatt-hour" (gCO₂eq/kWh), covering all stages from raw material extraction to factory manufacturing.
Power Generation Technology | Global Average Carbon Emission Intensity (gCO₂eq/kWh) | Remarks |
Coal Power | 820 - 1050 | Mainly direct combustion emissions |
Natural Gas Power | 490 - 650 | |
Polycrystalline Silicon PV | 20 - 40 | Mainly from electricity consumption during manufacturing |
Monocrystalline Silicon PV | 25 - 45 | Very small difference from polycrystalline, depends on energy mix of manufacturing location |
Nuclear Power | 5 - 12 | |
Wind Power | 8 - 15 | |
Data source: Comprehensive estimates based on IPCC and NREL reports.
Factors affecting carbon footprint: The carbon footprint of module manufacturing is highly dependent on the grid structure of the production location. If a factory uses grid electricity primarily based on coal power, the carbon footprint of its products will be close to the upper limit of the range; if the factory uses a lot of hydropower, nuclear power, or its own PV generation, the carbon footprint can be close to the lower limit.
Brief comparison with thin-film cell technology
For a more comprehensive assessment, it is necessary to compare it with another mainstream technology - Cadmium Telluride (CdTe) thin-film cells.
l Energy Payback Time (EPBT): CdTe thin-film cells typically have a lower EPBT, reaching 0.6 to 1.0 years, because their active material layer is thinner and uses very little semiconductor material.
l Use of rare elements: Tellurium and Cadmium are relatively rare elements, and the sustainability of their long-term supply is debated. Silicon is the second most abundant element in the Earth's crust, with almost unlimited raw material supply.
l Heavy metal concerns and control: Cadmium is a toxic heavy metal, but CdTe thin films have very low leaching rates after encapsulation, and recycling technology can effectively capture the cadmium, ensuring safe management throughout the life cycle.
Durability and long-term low-carbon electricity guarantee
Another dimension of sustainability is the product's service life and reliability.
l Operating cycle of over 25 years: Polycrystalline silicon modules typically come with a linear power output warranty of over 25 years. Their stable physical and chemical properties ensure that equipment does not need to be replaced frequently during its life cycle, avoiding additional manufacturing and transportation carbon emissions.
l Degradation rate: The annual degradation rate of high-quality polycrystalline silicon modules can be controlled below 0.5%. After 25 years, their output power can still be maintained above 85% of the initial value, providing long-term, stable low-carbon power supply, continuously replacing fossil fuels.
Cons
The main disadvantages of polycrystalline silicon solar panels are reflected in efficiency, high-temperature performance, appearance, and market trends.
Their conversion efficiency is typically 15-17%, lower than the 20-23% of monocrystalline panels, requiring a larger area for the same power output.
The power temperature coefficient is approximately -0.41%/°C; in high-temperature environments (e.g., 45°C), the output power loss is about 3.5% higher than that of monocrystalline panels.
Low Photoelectric Conversion Efficiency
Microscopic mechanisms of efficiency loss
At the atomic level, grain boundaries are regions of discontinuous crystal structure.
When photons strike the silicon material and generate electron-hole pairs (carriers), these carriers need to move to the circuit to generate electricity.
However, grain boundaries contain a large number of dangling bonds and defect energy levels, which trap and recombine (annihilate) carriers, preventing them from forming an effective current.
It can be understood that when electrons pass through these chaotic grain boundaries, it is like vehicles passing through an intersection full of toll booths and obstacles, significantly reducing speed and flow.
Data performance: Studies show that the carrier recombination rate at grain boundaries can be an order of magnitude higher than inside the grains. This bulk recombination and surface recombination are the fundamental reasons why the efficiency of polycrystalline silicon cannot break through the theoretical limit of about 23%, while the laboratory efficiency of PERC monocrystalline silicon has exceeded 26%.
Quantitative gap compared to monocrystalline silicon
Looking at commercially mass-produced modules, the efficiency gap is very stable and obvious.
Technical Parameter | Polycrystalline Silicon Module (Typical Value) | Monocrystalline Silicon PERC Module (Typical Value) | Gap Analysis |
Conversion Efficiency | 16.5% - 17.5% | 20.5% - 22.0% | Absolute efficiency difference of about 3.5-4.5 percentage points |
60-cell format power | 330W - 350W | 400W - 440W | Power output per module is about 70W lower |
Temperature Coefficient | -0.40%/°C | -0.35%/°C | Faster efficiency degradation at high temperatures, larger actual operating gap |
Actual impact on system cost and power generation
The efficiency gap directly translates into requirements for installation area and Balance of System (BOS) cost.
1. Increased footprint: To build a 10-kilowatt rooftop PV system, assuming a local average daily peak sun hours of 4.
l Using monocrystalline PERC panels with 20% efficiency, the required total area is approximately: 10,000W / (1000W/m² * 20%) = 50 square meters.
l Using polycrystalline panels with 17% efficiency, the required total area is approximately: 10,000W / (1000W/m² * 17%) ≈ 58.8 square meters.
l Result: The polycrystalline silicon system requires nearly 9 square meters more of usable roof area. For residences with limited roof space, this may directly prevent the system capacity from reaching expectations.
2. Increased Balance of System (BOS) cost: A larger installation area requires more racking rails, longer cables, and more man-hours for installation. These are collectively referred to as BOS costs. Studies show that for every 1% increase in module efficiency, BOS costs can be reduced by about 0.5%.
Significantly Affected by Temperature
What the temperature coefficient indicates
The peak power temperature coefficient is a negative value, indicating the percentage by which the solar panel's output power decreases for every 1 degree Celsius increase in temperature.
For example, a polycrystalline silicon panel with a rated power of 400W has a temperature coefficient of -0.40%/°C.
When the panel temperature rises from the standard test condition of 25°C to 35°C, its power loss is calculated as follows:
l Temperature difference: 35°C - 25°C = 10°C
l Power loss rate: -0.40%/°C × 10°C = -4%
l Actual output power: 400W × (1 - 4%) = 384W
On a hot summer day, it is not uncommon for the actual operating temperature of the solar panel surface to reach 65°C. In this case:
l Temperature difference: 65°C - 25°C = 40°C
l Power loss rate: -0.40%/°C × 40°C = -16%
l Actual output power: 400W × (1 - 16%) = 336W
l In a high-temperature environment, this panel rated at 400W actually only outputs 336W of power, a loss of 64W.
Polycrystalline vs. Monocrystalline Silicon
Polycrystalline panels typically have a higher temperature coefficient (i.e., a larger negative value). The typical temperature coefficient ranges of current mainstream technologies are compared below:
Technology Type | Typical Peak Power Temperature Coefficient Range | Power Loss at 65°C Panel Temperature (using a 400W module as an example) |
Polycrystalline Silicon | -0.39%/°C to -0.43%/°C | 15.6% to 17.2% (62.4W - 68.8W) |
Monocrystalline Silicon PERC | -0.34%/°C to -0.36%/°C | 13.6% to 14.4% (54.4W - 57.6W) |
As can be seen from the table above, at a high temperature of 65°C, a polycrystalline panel loses about 5-11 watts more power per panel than a monocrystalline PERC panel.
For an 8kW system composed of 20 panels, during a sustained hot afternoon, the total output power of the polycrystalline system may be 100 to 220 watts less than that of the monocrystalline PERC system.
Cumulative effect of power generation loss in high-temperature regions
For regions with perennial high temperatures and strong sunlight, such as Arizona (USA), Saudi Arabia, or inland Australia, the impact of temperature on power generation is particularly pronounced.
In these areas, solar panels operate at ambient temperatures above 40°C for a large part of the year, and the panel surface temperature often exceeds 60°C.
Taking a 10kW system in Phoenix, Arizona as an example, assuming an average annual peak sun hours of 2100 hours.
l Monocrystalline PERC system (temperature coefficient -0.35%/°C), average annual power generation loss due to temperature is about 6%.
l Polycrystalline silicon system (temperature coefficient -0.41%/°C), average annual power generation loss due to temperature may reach 7.5%.
l Average annual power generation gap: 10,000W * 2100 hours/year * (7.5% - 6%) = 315 kWh/year.
Over the 25-year system lifespan, the polycrystalline silicon system, being more sensitive to temperature, will generate about 7875 kWh less in total than the monocrystalline PERC system.
Calculated at the local electricity price of $0.15/kWh, this is equivalent to a reduction in electricity revenue of about $1,180.
Low Space Utilization Efficiency
Efficiency directly determines area requirements
The rated power (watts, W) of a solar panel reflects its peak power generation capability.
Under standard sunlight conditions, how much electricity a panel can generate depends directly on its area and efficiency.
The formula for efficiency (η) is: η = Output Power / (Incident Light Power × Area).
Therefore, to achieve the same total system power, panels with lower efficiency require a larger total area.
Let's calculate using a typical 6-kilowatt (kW) residential solar system as an example:
l Assume high-efficiency monocrystalline PERC panels with 21.5% efficiency, each panel rated at 400W.
l Assume polycrystalline silicon panels with 17.0% efficiency, each panel rated at 320W.
l To achieve a total system power of 6kW (6000W):
l Number of monocrystalline PERC panels needed: 6000W / 400W/panel = 15 panels
l Number of polycrystalline silicon panels needed: 6000W / 320W/panel ≈ 19 panels (rounded up, actually need 19 panels to reach 6080W)
Now calculate the footprint. Assume each monocrystalline panel has an area of about 2 square meters, and each polycrystalline panel has an area of about 1.8 square meters (polycrystalline panels are typically lower power and slightly smaller in area per panel, but have lower power per unit area).
l Monocrystalline PERC system total area: 15 panels × 2.0 square meters/panel = 30.0 square meters
l Polycrystalline silicon system total area: 19 panels × 1.8 square meters/panel = 34.2 square meters
Impact on total system cost goes beyond the modules themselves
Choosing modules with lower efficiency brings additional costs not only in potentially needing more panels.
A more important impact is the increase in "Balance of System" (BOS) costs. BOS costs include racking structures, cables, junction boxes, and labor installation costs.
l More installation hardware: Installing 19 panels compared to 15 panels requires longer racking rails, more clamps and bolts. Cable usage will also increase accordingly because more panels need to be connected.
l Longer installation time: The time required for installers to move, position, and secure 19 panels is typically longer than for 15 panels. This directly increases labor costs.
l Data support: Research by the US National Renewable Energy Laboratory (NREL) shows that for every 1% increase in module efficiency, balance of system costs can be reduced by about 0.4% to 0.6%. For the 6kW system mentioned above, the polycrystalline solution's efficiency is 4.5 percentage points lower, and the resulting increase in BOS cost may offset any small advantage in the unit price of the polycrystalline panels.
Specific impact in different application scenarios
The importance of space utilization efficiency varies by project type.
1. Residential Rooftop: The impact is greatest. The available roof area is usually a strictly limited fixed value. The homeowner's goal is often to achieve the highest possible power generation on the limited roof space, aiming to cover household electricity needs to the greatest extent possible (achieving a higher "self-consumption" ratio) or meeting grid connection power limits.
2. Commercial Flat Roof: Significant impact. Although commercial buildings have large roof areas, they are also full of obstacles: ventilation ducts, air conditioning units, elevator machine rooms, etc.
3. Large Ground-mounted Power Plants: The impact is relatively small, but still exists. In areas with low land prices, land cost may not be the primary factor.
Use Cases
Polycrystalline silicon solar panels dominate the global application market, still accounting for about 60% of global module shipments in 2023.
Their competitiveness lies in their significant cost advantage, with a selling price per watt typically $0.01 to $0.02 lower than monocrystalline PERC products, and an efficiency range stable at 17% to 19.5%.
Large-scale Ground-mounted Power Plants
Relationship between project site selection and land cost
In western Texas, the lease cost for desert land is about $100-$200 per acre per year.
A 300-megawatt photovoltaic power plant requires about 1500 acres of land, with an annual land cost controlled between $150,000 and $300,000.
Such land prices allow developers to accept polycrystalline silicon products that are relatively less efficient but more cost-effective.
In contrast, similar projects in land-constrained areas like New Jersey, where land costs exceed $2,000 per acre per year, tend to favor high-efficiency modules to maximize power generation per unit area.
Calculation method for Levelized Cost of Energy (LCOE)
Taking a 250 MW project in Arizona as an example, which uses polycrystalline silicon modules with 17.6% efficiency:
l Module procurement cost: $0.22/W
l Total system construction cost: $0.89/W
l Annual full load hours: 2100 hours
l The calculated LCOE is $0.034/kWh. If monocrystalline modules with 21% efficiency were used instead, although the system footprint could be reduced by 12%, the LCOE would rise to $0.038/kWh, increasing the total cost by about $12 million over the 25-year operating period.
Mounting system and installation details
The weight and mechanical properties of polycrystalline silicon modules influence the mounting system design. Typical installation solutions include:
1. Fixed tilt mounts: Steel mounting weight is 12-15 kg per square meter
2. Single-axis tracking system: Increases power generation by 25%, but initial investment increases by 18%
3. Foundation type: Helical pile foundations are suitable for most soil types, each pile supporting 4-6 modules
In areas with wind speeds exceeding 130 km/h, the mounting system requires additional reinforcement, increasing structural costs by 5-8%.
Technical requirements for grid connection
When the power plant scale exceeds 200 MW, reactive power compensation devices need to be configured. Common solutions include:
l Static Var Compensator (SVC): Response time less than 20 milliseconds
l Central inverters: Single unit capacity 2.5-3.5 MW, conversion efficiency over 98.5%
l The power plant must have voltage regulation capability and maintain stable operation when grid frequency fluctuates (within the range of 59.3-60.5 Hz).
Specific indicators for O&M management
During the power plant operation phase, the main focus is on these data:
l Cleaning cycle: Every 6 weeks in arid areas, can be extended to 12 weeks in areas with abundant rainfall
l Degradation rate: First-year degradation not exceeding 2%, thereafter annual degradation rate controlled below 0.6%
l Fault detection: Drone thermal imaging inspection can scan about 800 acres of modules per week
l Weeding operation: Conducted 3-4 times a year to maintain ventilation under the modules
Systems using predictive maintenance can reduce average fault downtime from 72 hours to less than 24 hours.
Parameter comparison for module selection
When making procurement decisions, technicians establish an evaluation matrix like this:
Parameter Category | Polycrystalline Silicon Solution | Monocrystalline PERC Solution |
Module Efficiency | 17.8-18.2% | 20.3-20.8% |
Temperature Coefficient | -0.39%/℃ | -0.35%/℃ |
Annual Degradation Rate | 0.6% | 0.5% |
Land Use per Megawatt | 4.8-5.2 acres | 4.1-4.4 acres |
25-year Output Warranty | 82% | 85% |
Actual power generation data records
A 200 MW project in California that has been operating for 8 years shows:
l Actual annual power generation: 420 million kWh (3.8% higher than the feasibility study forecast)
l Average O&M cost: $0.004/kWh
l Availability: 98.7%
l This power plant uses polycrystalline silicon modules. At an ambient temperature of 45°C, the measured power degradation is 12.3%, which basically matches the -0.39%/°C temperature coefficient specified in the product datasheet.
Infrastructure construction details
The power plant's auxiliary facilities include:
l Collection lines: Total length of 35kV cables is about 85 km
l Step-up substation: Configured with 2 units of 120 MVA main transformers
l Monitoring system: Includes 3200 string monitoring points
l Road network: Permanent road width 6 meters, total length 12 km
The cost of these infrastructures accounts for about 22-25% of the total project investment.
Specific impact of environmental factors
In areas with high wind and sand, dust accumulation on the module surface can cause a power generation loss of 6-8% per month. Measured data indicates:
l When dust density reaches 10 grams per square meter, power generation decreases by about 5%.
l Rainfall exceeding 15 mm is required to achieve a natural cleaning effect
l Modules with a tilt angle of 25 have about 30% better self-cleaning effect than those at 10 tilt
Therefore, in arid regions, vehicle-mounted cleaning systems need to be configured. Each cleaning can improve system efficiency by 5-7 percentage points.
Commercial and Industrial Rooftop PV
Installation solutions vary by industry
l Manufacturing companies: Continuous production enterprises like injection molding plants and food processing plants have stable load curves; the installation capacity can reach the roof load-bearing limit.
l Logistics warehouses: Electricity usage during weekdays is concentrated on lighting and sorting equipment, with lower loads on weekends; suitable for configuring systems with lower capacity.
l Shopping malls and supermarkets: Refrigeration load accounts for a high proportion; the system's power generation coincides with air conditioning usage peaks by 70%.
Taking an auto parts factory in California as an example, the factory has a roof area of about 9200 square meters and installed a 1.2 MW polycrystalline silicon system.
This system generates about 1.76 million kWh of electricity annually, meeting 65% of the factory's daytime electricity demand.
Structural assessment requires participation of professional engineers
A structural assessment must be conducted before installation, including:
1. Roof load-bearing capacity inspection: Concrete roofs typically require a load-bearing capacity of at least 25 kg per square foot.
2. Waterproofing membrane condition check: Use infrared thermal imagers to detect potential leakage points.
3. Ventilation equipment clearance distance: Modules need to be at least 3 feet away from ventilation equipment.
For buildings over twenty years old, steel structure reinforcement may be needed, accounting for 5% to 8% of the total system cost.
Choice of grid connection method affects system revenue
Commercial and industrial projects mainly have three grid connection schemes:
l Full Feed-in Tariff: Suitable for areas with high electricity price subsidies; all electricity generated by the system is sold to the grid.
l Self-consumption with surplus feed-in: The most common model; prioritizes consuming self-generated electricity, excess power is injected into the grid.
l Net Metering: Forms two-way metering with the grid; the meter records net electricity consumption.
System design needs to consider partial shading
The design needs to use string inverters combined with optimizer solutions to control shadow losses within 8%.
For roofs containing air conditioning outdoor units and ventilation ducts, drone 3D modeling is needed to accurately calculate the spacing and tilt angle of each row of modules.
O&M management includes regular inspection items
l Quarterly inspection of junction box sealing condition.
l Monthly cleaning of module surfaces; cleaning frequency needs to be increased in industrial areas with heavy dust.
l Weekly check of inverter operating data, focusing on DC side insulation resistance value.
l Annual infrared thermal imaging detection to promptly identify cell micro-crack issues.
Technical specifications have clear requirements
Modules for commercial and industrial systems need to meet:
l Fire rating: Class A fire certification.
l Wind load capacity: Must withstand wind speeds of at least 140 km/h.
l PID degradation: Under system operating voltage, first-year power degradation should not exceed 3%.
The installation process requires coordination of multiple parties
Typical project schedule:
l Weeks 1-2: Site survey and structural assessment.
l Weeks 3-4: System design and permit application.
l Weeks 5-7: Equipment procurement and transportation.
l Weeks 8-12: Installation construction and commissioning.
l Week 13: Grid connection acceptance and trial operation.
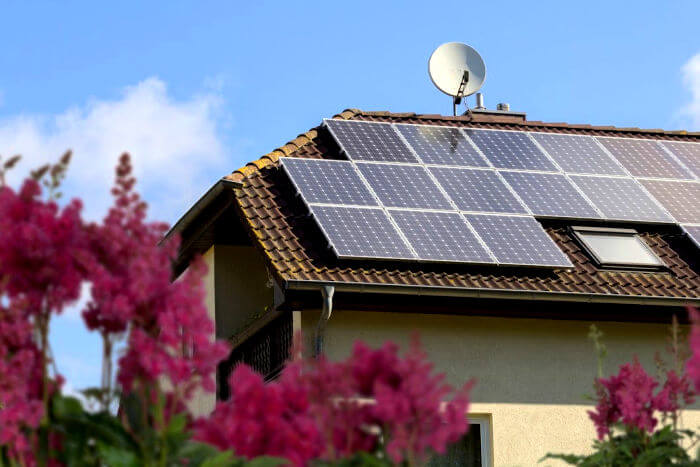
Residential Rooftop Systems
Roof type determines installation solution
Common installation methods for sloped roofs include:
l Tile roofs: Use hook-type brackets fixed to the roof rafters; after installation, the original drainage function of the roof is maintained.
l Metal roofs: Use clamping fixation solutions, no need to penetrate the roof waterproofing layer.
l Flat roofs: Need to install tilt brackets; appropriate spacing must be reserved between module arrays to prevent shading.
System design considers partial shading
Even small-scale shadows can significantly affect power generation. Optimizers or microinverter solutions need to be used in the design.
For example, shadow from a tree in the afternoon may reduce the power generation of a traditional series system by 20%, while using a module-level power electronics solution can control the loss within 5%.
Module orientation has a significant impact on power generation efficiency:
l Due South orientation: Highest power generation efficiency, annual utilization rate can reach 98%.
l East-West orientation: Comprehensive efficiency is about 85-90% of due south orientation.
l North orientation: Generally not recommended for installation, efficiency is less than 60% of south orientation.
These materials are needed for grid connection application
Homeowners need to submit to the power company:
1. System design drawings and single-line electrical diagrams.
2. Equipment certification documents (UL certification list).
3. Installation company qualification certificate.
4. Building permit approval documents.
The entire approval process usually takes 15-30 working days. Some areas require the installation of a separate bidirectional meter, costing between $200-$500.
O&M requires regular execution of these operations
l Monthly check of inverter display data, record daily power generation.
l Clean module surfaces every six months to remove dust and bird droppings.
l Annual inspection of electrical connection point tightness.
l Check mounting bracket firmness after storms.
Module selection needs to consider these parameters
Comparison of polycrystalline silicon and monocrystalline silicon in residential scenarios:
Performance Indicator | Polycrystalline Silicon Solution | Monocrystalline PERC Solution |
Module Efficiency | 17-18% | 20-22% |
Temperature Coefficient | -0.39%/℃ | -0.34%/℃ |
25-year Power Warranty | 82% | 85% |
Cost per Watt | $0.25 | $0.30 |
Safety specifications have clear requirements
l Fire separation: Keep at least 0.3 meters from the module edge to the roof edge.
l Grounding resistance: Less than 1 ohm.
l DC arc fault protection: AFCI (Arc-Fault Circuit Interrupter) device required.
l Emergency access: Maintain a maintenance access path with a width of no less than 0.6 meters.
The installation process is divided into these stages
Typical project schedule:
1. Week 1: Site survey and structural assessment.
2. Week 2: System design and solution confirmation.
3. Weeks 3-4: Equipment procurement and permit application.
4. Weeks 5-6: Installation construction and electrical connection.
5. Week 7: Grid connection acceptance and system commissioning.
Actual power generation is affected by these factors
Monitoring data shows:
l For every 10°C increase in ambient temperature, power generation efficiency decreases by about 3.5%.
l Dust accumulation can reduce monthly power generation by 4-8%.
l Inverter efficiency loss is typically between 2-3%.