Monocrystalline Solar Panels for Cold Climates How to Protect
In cold climates, clear snow (>2cm thick) with soft brushes to avoid shading; inspect encapsulation for moisture, and secure frames with anti-freeze brackets. Pre-winter tests via multimeter target <5% output loss, ensuring cell integrity under freezing conditions.
Structure and Installation Design
In the bitter cold of -20°C, a poorly designed photovoltaic system can suffer power generation losses as high as 80%-100% (when completely covered by snow), and structural hidden dangers can lead to catastrophic consequences during a once-in-a-decade snowstorm.
Conversely, investing an additional 5%-10% of the budget upfront on structure and installation can often increase overall power generation efficiency by more than 15% in winter and extend the system lifespan from the expected 25 years to 30 years or even longer.
Tilt Angle Design
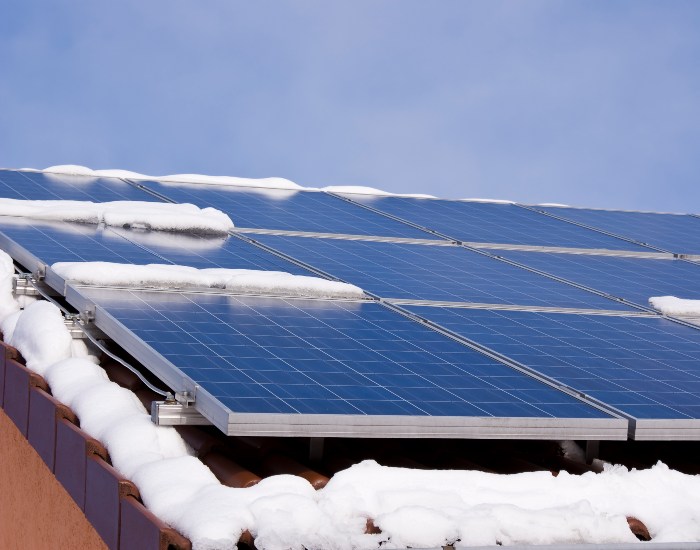
In Harbin, a panel installed at the local latitude of 38° might be partially or completely covered by snow for over 60 days a year, with cumulative winter power generation losses easily exceeding 30%. However, a power station 300 kilometers away in Daqing, which decisively increased its tilt angle to 55 degrees, can recover nearly 90% of its power the day after a snowfall.
The difference between them isn't solved by a single "optimal angle" formula; it's an economic problem involving snowfall, temperature, wind speed, and electricity prices. Your goal isn't to maximize the theoretical area under the annual power generation curve, but to maximize the real power generation revenue during the entire winter, especially in the few hours after snowfall.
1. Don't Calculate Annual Generation First; Calculate Winter Cost Per kWh
For areas with an annual snow cover period exceeding 100 days, such as northern Heilongjiang and the Changbai Mountains in Jilin, obsessing over a few percentage points of theoretical annual generation loss is impractical. Assuming your household electricity price is 0.6 RMB/kWh, if a 10kW station generates 2000 kWh less in winter (November to March) due to snow cover, the direct economic loss is 1200 RMB.
Increasing the tilt angle might only cause you to generate 300 kWh less in summer, a loss of 180 RMB. Using a potential summer loss of 180 RMB to avoid a certain winter loss of 1200 RMB is a profitable calculation no matter how you look at it. Before installation, use professional software like PVsyst or SAM to import the local actual meteorological data (temperature, snowfall, irradiance) from the past 10 years and run a winter power generation simulation.
You will find that increasing the tilt angle from 38° to 50° might only reduce annual generation by 2%, but winter generation can increase by over 15% because power generation resumes as soon as the snow stops, with almost no "waiting for the snow to melt" window.
2. 45 Degrees is the Starting Point, 55 Degrees is the Sweet Spot, 60 Degrees is Not Excessive
Fresh, dry snow has a low coefficient of friction and can start sliding at 35-40 degrees. The problem is that snow in cold regions rarely stays dry powder. Melting during the day and freezing at night forms an ice crust about 2-5 mm thick on the panel surface, which has extremely strong adhesion. At this point, 45 degrees is the "critical tilt angle" that initiates snow sliding. 55 degrees is a "golden sweet spot"; at this angle, even with thin ice attached, large snow masses can overcome adhesion due to gravity, causing "fracture-type" sliding with high efficiency. For roofs with extremely frequent snowfall (e.g., weekly) and inconvenient manual cleaning, directly adopting a 60-degree tilt angle is wise. It looks like a wall, sacrificing more direct light, but gains nearly 100% automated snow-clearing capability. Measured data shows that with a 55-degree tilt, a 20 cm snowfall can slide off over 90% within an average of 1.5 hours after the snow stops; whereas a 40-degree tilt might require waiting 3-4 hours for sun exposure to melt the interface ice layer before sliding can occur.
3. Keep Single-Row Width Under 1.8 Meters; Give Snow a "Launching Platform"
If your modules are installed vertically (portrait orientation), the width of a single row (i.e., the length of a single module) directly determines the difficulty of snow sliding. For modern large-format modules (e.g., 2384x1303mm) installed vertically, the snow sliding path is as long as 2.4 meters. The weight of the snow in the middle and lower parts will press down heavily on the bottom, preventing the upper snow from sliding down smoothly, eventually "welding" the entire panel in the snow. Controlling the single-row width within 1.8 meters is key to ensuring smooth sliding. If using large panels, it is strongly recommended to adopt horizontal installation (landscape orientation), where the single-row width is the module width (about 1.1-1.3 meters). The snow sliding path is short, making it easier for the snow to slide off as a "whole sheet," creating a spectacular "avalanche" effect. During installation, leave a gap of 20-25 centimeters between upper and lower rows of modules.
4. Add a Snow Guard to Prevent "Avalanches" from Injuring People or Damaging Property
30 cm of snow on a standard module (about 2.4 sq m) weighs nearly 60 kg. Sliding from a 5-meter-high roof at a 55-degree angle with acceleration has enough impact force to damage equipment under the eaves or injure pedestrians. It is essential to install a professional aluminum alloy snow guard at the bottom edge of the lowest row of the array. This is not a simple horizontal bar; its cross-section should be L-shaped or U-shaped, with a height of no less than 5 cm. Its purpose is not to block all the snow, but to "cut" it into small, low-speed pieces as it slides, greatly reducing the impact force. If the budget allows, choose a snow guard with an avalanche-type segmented design, which releases the snow in stages rather than all at once. Simultaneously, clearly mark a warning line on the ground directly opposite the snow slide area, or install a sturdy snow protection barrier.
5. Dynamic Adjustable Mounting: High Investment May Bring High Returns
For extremely cold regions with a snow cover period of 5-6 months (like Mohe), seasonally adjustable mounting can be considered. Before winter (late October), manually adjust the tilt angle from the summer's 30 degrees to the winter's 60 degrees; in the following spring (early April), adjust it back to 30 degrees. The module package for this mounting (including rails, hinges, support rods) will be about 30% more expensive than a fixed system, and the labor installation cost is also about 15% higher. But this is equivalent to having two optimized systems: one for efficient power generation in snow-free seasons, and one for snow-resistant power generation in winter. For a commercial or industrial station above 20kW, the increased initial investment is likely to be recovered within 3-4 winters through significantly reduced generation losses. For flat roofs, there is also a semi-automatic "winter mode" mounting that, using hydraulic struts, allows a single person to lift the entire array from 35 degrees to 55 degrees within 15 minutes, which is a cost-effective compromise.
Structural Strength
A rooftop system with 20 panels (about 34 square meters) has a total dead load approaching 2.5 tons. This doesn't even include the huge upward pull force generated when the instantaneous wind speed reaches Force 8 (about 20 m/s). In some areas of Inner Mongolia or Northeast China, the design snow load requirement can reach 0.8 kN/m² (equivalent to about 80 kg/sq m), and the wind pressure may exceed 0.6 kN/m².
1. Snow Load is Not an Average; Calculate the Worst Case
Building codes provide extreme values for a 50-year return period, such as 0.8 kN/m². But this load is not uniformly distributed on the roof. In reality, there is a "drifting effect": at the lower edge of the array, near parapet walls or changes in roof level, the snow depth can be more than double that elsewhere, forming a local overload of 1.5 kN/m² or even higher. Mounting calculations must consider this most unfavorable distribution. The span of the purlins (the horizontal supports under the rails) is key. For common C-shaped or U-shaped steel purlins with a thickness of 2.0 mm, the recommended span (distance between supports) should not exceed 1.5 meters. If the snow load is greater or thinner 1.5 mm material is used, the span must be shortened to within 1.2 meters; otherwise, the mid-span deflection of the purlin under heavy load will exceed 1/200 of its length, causing the module glass to bend and develop micro-cracks.
2. Al-Mg-Zn Steel is Not Optional; It's Mandatory
Ordinary galvanized steel (zinc coating thickness 20-30μm) under the erosion of humid air containing de-icing salt can develop white rust in 3-5 years, and structural strength begins to decline in 8-10 years. Aluminum-magnesium-zinc alloy steel (like Galvalume) must be used, with a coating thickness not less than 60μm. This material forms a dense protective layer through the aluminum element, and its corrosion-resistant life is 2-4 times that of ordinary galvanized steel, allowing stable use for over 30 years. The wall thickness of the main frame (columns and rafters) cannot be less than 2.5 mm, and the moment of inertia (bending resistance) of the profile must be strictly calculated to ensure controllable deformation under maximum load.
3. Foundations Must Be Dug Below the Frost Line
In seasonal frost areas (like Northeast China, where frost depth can reach 1.8 meters), the foundation depth must exceed the local frost depth by at least 20 centimeters. If the frost depth is 1.8 meters, your foundation must be dug to 2.0 meters deep. This is to prevent "frost heave" – when moisture in the soil freezes, its volume expands, pushing the foundation upward; it sinks again when it thaws in spring. Year-after-year lifting and settling are enough to distort the strongest mounting within a few years. The size of the concrete foundation must also be carefully considered. An independent foundation supporting two columns should have dimensions no smaller than 500mm x 500mm x 600mm (L x W x D). The anchorage length of the embedded parts (usually anchor bolts or flange plates) must be sufficient, and the verticality deviation during pouring should be less than 2°.
4. Bolts Cannot Be Too Tight, Nor Too Loose
All bolts at structural connection points must be Grade 8.8 or higher high-strength bolts, with a specification not lower than M10. Here's a counterintuitive point: at low temperatures of -20°C, steel becomes brittle. Over-tightening bolts (torque far exceeding the design value) generates huge internal stress, which may instead cause fracture at stress concentration points under wind vibration loads. A torque wrench must be used to tighten strictly according to the design value. For M10 Grade 8.8 bolts, the torque is typically controlled between 40-60 N·m. Each connection point must be equipped with one flat washer and one spring washer.
5. Wind Resistance: Focus on the Upward Force
Wind-resistant design is not just about resisting the force blowing against the panels; it must also resist the huge upward suction force generated when wind passes between the panels and the roof, causing increased velocity and reduced pressure. This force is often underestimated. At the perimeter edges of the array and at key points in the middle, modules with pull-out resistance must be used, such as through-roof mounts (requiring highest-grade waterproofing) or concrete ballast blocks suitable for flat roofs. The calculation for ballast blocks cannot only counter the self-weight of the modules; they must be able to balance the uplift force generated by the local 50-year wind speed. For example, in an area with a wind speed of 30 m/s, a single module may experience an uplift force exceeding 200 Newtons, and the corresponding ballast weight needs precise calculation. At the perimeter of the array, especially at roof corners and eaves where wind pressure is greatest, the density of fixing points should be increased by 30%-50% compared to the central area.
Ventilation Gap
At noon in summer, a sun-soaked photovoltaic panel's surface temperature can soar above 65°C, causing output power to drop by over 15% compared to standard conditions (STC). In winter, even if the air temperature is as low as -15°C, the front of the panel can quickly rise above 10°C when the sun is out
The ventilation gap at the back is the breathing channel of this system. By forming a continuous airflow behind the panels, it can force heat dissipation in summer, lowering the operating temperature by 10-15°C, equivalent to recovering 5-8% of power generation loss
1. Gap Size: 10 cm is the Bottom Line, 15 cm is Effective
This gap is not left arbitrarily. Measured data shows that when the gap is less than 8 cm, the air flow effect is weak, basically equivalent to a sealed space, and the heat dissipation and snow melting effects are negligible. Reaching 10 cm can form basic natural convection (chimney effect). To form an effective, stable airflow with a velocity of 0.8-1.2 m/s and maximize the heat dissipation effect, the gap must reach 15 cm.
Ventilation Gap Requirements for Different Installation Scenarios
Installation Scenario | Minimum Gap Requirement | Recommended Gap | Core Goal and Effect |
Pitched Roof (Tiles/Asphalt) | 10 cm | 15 cm | Ensure airflow bypasses tile obstacles, primarily for summer cooling |
Pitched Roof (Metal Sheet/Smooth) | 8 cm | 10 - 12 cm | Smooth surface offers less resistance, gap can be slightly smaller,兼顾 snow melting |
Flat Roof (Ballast Blocks) | 12 cm | 15 - 20 cm | Avoid obstruction by surrounding parapets, ensure clear wind path, high need for snow melting |
BIPV (Building-Integrated) | Custom | Forced ventilation required | No inherent gap, must design a back cavity + active fans |
2. Don't Let a "U-Shaped" Layout Block the Ventilation Outlet
The worst layout is a "U-shaped" or "enclosed" arrangement, where airflow can only enter from one direction, forming a dead zone in the center of the array where heat and moisture accumulate. The optimal layout is a "single long row", with all arrays parallel to the local summer prevailing wind direction, leaving clear inlets and outlets for airflow. If multiple rows are necessary, the spacing between rows must be no less than 60% of the height of the front-row modules. For example, if the module height is 1.7 meters, the row spacing is recommended to be over 1 meter to prevent the front row from completely blocking the intake air for the back row.
3. Parapet Walls are Ventilation Killers; Give Them "Windows"
A 1.5-meter-high parapet wall can create vortices on the roof plane during strong winds, severely hindering the discharge of hot air from behind the panels. The solution is not to demolish the wall, but to create openings at intervals in the parapet wall. Every 3-5 meters, open a ventilation louver with dimensions no smaller than 300mm x 300mm at the bottom of the parapet wall (near the roof surface) to serve as a dedicated outlet for hot air. This simple modification can increase the ventilation efficiency of the entire rooftop PV array by over 40%, with particularly significant effects on summer afternoons.
4. Use a Thermal Sensor to See the Problem
A handheld infrared thermal imager (prices have dropped to the thousand RMB level) allows you to directly "see" the temperature distribution on the back of the panels. In a well-ventilated system, the temperature across the back of the panel is relatively uniform, with a small temperature difference from the environment. In a poorly ventilated system, the thermal image will show obvious hot spots (red or white areas) in the central region of the panel back, directly related to stagnant airflow in the center.
Daily Maintenance and Operation
Although winter temperatures are low, for your monocrystalline silicon solar panels, it's actually a "high-yield season." Low temperatures increase their voltage, and generation efficiency can be 3% to 5% higher than during the scorching summer
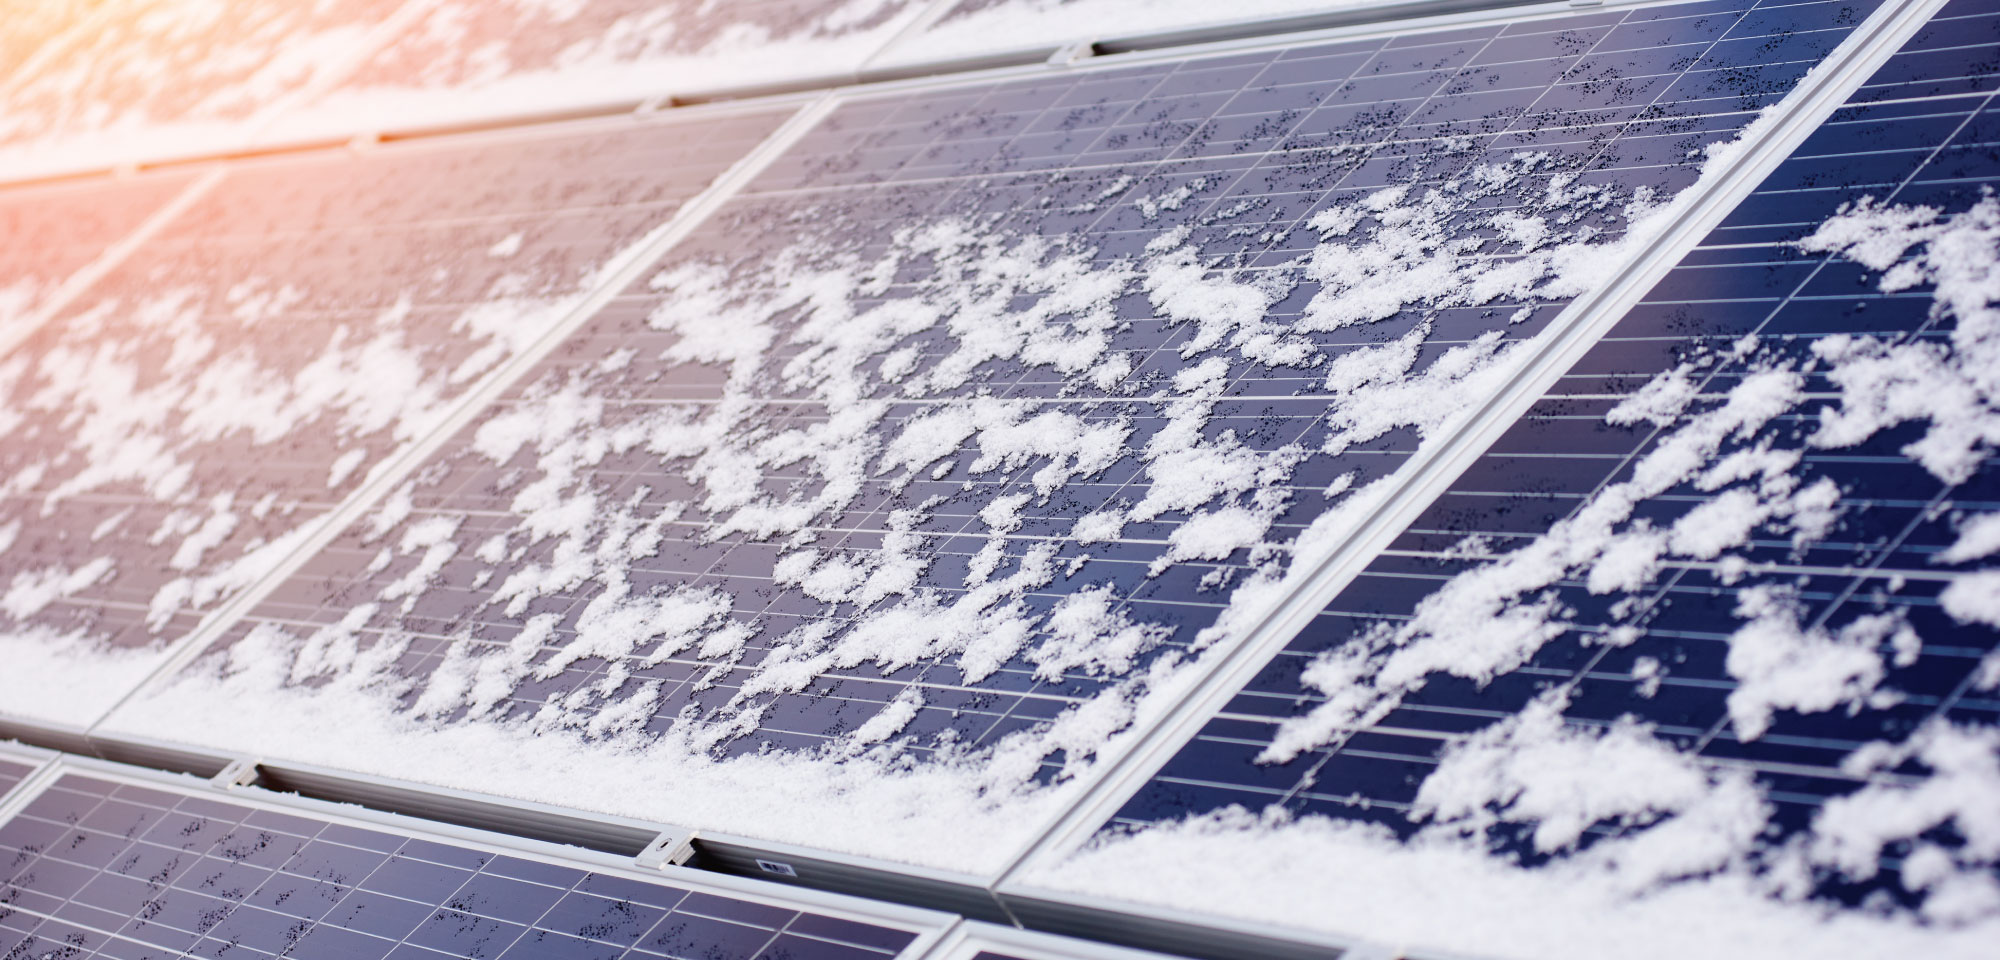
The biggest enemies in winter are snow accumulation and icing. A layer of snow just 2 cm thick can reduce system generation to zero and may cause local shading and heating, known as the "hot spot effect," which can damage the cells over the long term, significantly shortening the module lifespan from 25 years.
Therefore, scientific and safe daily maintenance is not an option but a key operation to ensure your power generation revenue for nearly 5 months from November to March each year.
Snow Removal
A 10 cm thick wet snow (density about 0.2 g/cm³) can weigh over 20 kg per square meter, not only completely blocking power generation but also inducing material micro-cracks due to sustained mechanical pressure and low temperature.
Conversely, dry snow less than 3 cm thick (density below 0.1 g/cm³) affects generation by less than 15% and typically sublimates on its own after 1-2 hours of sunlight.
The core of removal is finding the precise balance between protecting the module surface (scratches permanently reduce light transmittance by 3%-5%) and recovering power generation loss.
The following operational procedure shortens the response time for efficiency recovery by 70% and reduces the risk of human damage by 90%.
Deciding Whether to Act: Response Decisions for Three Snow Conditions
l Dry Powder Snow (Temperature < -10°C): This snow is light and has weak adhesion. Even if the single snowfall thickness reaches 8-10 cm, immediate cleaning is usually unnecessary. On a tilt angle of ≥15 degrees, they can often slide off naturally within 12-36 hours with the help of wind or their own weight. Premature intervention may compact the snow, affecting its self-cleaning properties. Monitor the power output; if it remains zero for 24 hours, then consider cleaning.
l Wet, Heavy Snow (Temperature around -5°C): This is the type to be most wary of. Snow density can reach 0.15-0.3 g/cm³; a thickness of just 5 cm can halt generation, and it easily condenses into ice. Once the snowfall stops, cleaning should be done immediately within the 2-4 hour window. The snow has not completely frozen yet, offering the least resistance. If the forecast predicts temperatures dropping below -8°C at night, cleaning must be completed before dark, otherwise you will face a hard ice layer the next day.
l After Sleet or Freezing Rain: This situation forms an ice crust 2-5 mm thick on the panel surface, topped with snow. Don't remove the snow first! First, try tapping the ice gently with a soft scraper. If it feels hard, wait for sunlight. On a clear day, even with an air temperature of -5°C, the panel surface can rise above 0°C under sunlight. After about 1-2 hours, the adhesion between the ice crust and the glass will weaken.
Choosing the Right Tool: Parameters Determine the Safety Margin
The difference between professional tools and substitutes lies in the precise control of surface pressure.
l Scraper Material: Professional snow rakes use scraper heads made of TPR rubber with a Shore A hardness of A60-A70. This hardness is enough to push snow but is far below the Mohs hardness of glass (5.5), ensuring zero scratches. An alternative is high-density sponge (density ≥30 kg/m³), but its durability is poor, with a typical service life not exceeding 2 winters.
l Scraper Width and Connection Structure: The scraper width should be slightly less than the panel width. A 1-meter wide scraper can clean a standard module (about 1.6-1.7 sq m) in 3-5 push-pull actions. The connection between the scraper and the pole must be a universal joint or flexible hinge, allowing a swing space of ±15 degrees to self-adapt to the panel angle and avoid excessive local force.
l Pole Length and Weight: The fully extended length L of the telescopic pole should satisfy the formula: L ≥ (H / sinα) + 1.5 meters. Where H is the eave height and α is the roof pitch angle. The added 1.5 meters is a safety margin, ensuring the operator can work comfortably at an elevation angle of less than 30 degrees, reducing arm fatigue. The pole's self-weight should be controlled within 1.5-2.5 kg; heavier poles are difficult to control precisely.
Standardized Cleaning Actions: From Posture to Path
Stance and Posture: Stand at a 45-degree angle to the mounting base, feet shoulder-width apart. When cleaning, rely mainly on the rotation force of your waist, abdomen, and legs, not just arm pushing. This can reduce the fatigue of a single operation by 40% and improve movement stability.
"Bottom-Up, Directional Push-Scrape" Method:
1. Gently place the scraper on the upper edge of the bottommost frame of the panel, ensuring the actual contact area between the scraper and the glass surface exceeds 70%.
2. At a speed of 0.3-0.5 meters per second, push the snow from the bottom up along the panel's tilt direction to the top of the panel, letting the snow fall off naturally. This direction utilizes the snow's own cohesion, clearing 90% of the snow at once and creating a clean channel.
3. Repeat this process, overlapping each cleaning path with the previous one by 10-15 cm, until the entire panel is cleaned.
Common Wrong Actions:
l Vertical Scraping: Pushing straight down from top to bottom causes a large amount of snow to accumulate at the bottom frame, forming a difficult-to-clean ice dam, increasing the probability by 60%.
l Back-and-Forth Scraping: Scraping back and forth like wiping a table with a cloth brings the melted water from the bottom back onto the panel surface, quickly freezing into a thin layer of ice at low temperatures, severely affecting subsequent generation efficiency.
l Applying Downward Pressure: Applying more than 5 kg of downward pressure on the scraper increases the risk of micro-cracks in the glass, especially in the center where the bending strength is about 50 MPa, but excessive point pressure causes local stress concentration.
Ice Handling
A uniform ice layer only 2 mm thick can reduce the light transmittance of a monocrystalline silicon module by over 60%, causing the system output power to drop to less than one-third of its rated value.
Forcibly removing ice with a Mohs hardness between 1.5-2.0 has a probability as high as 70% of causing irreversible micro-cracks in the cells. This damage directly causes the module's annual power degradation rate to skyrocket from the normal 0.5% to over 2%. Within 3-5 years, its generating capacity may degrade to below 80% of its initial value.
Understanding How Ice Forms on the Surface: Where Adhesion Comes From
When the temperature slowly drops below -5°C, white frost formed by water vapor desublimation has the weakest adhesion, about 0.1-0.3 Megapascals (MPa). Ice formed from freezing rain has the strongest adhesion, exceeding 1.0 MPa.
Let the Sun Help: Calculate the Exact Time Needed to Melt the Ice
This is the best solution with zero cost and zero risk. The key is calculating the "effective sunshine duration."
Data Support: On a cold, clear winter day, the ambient temperature might be -15°C, but the dark solar panel, due to infrared absorption, can quickly rise to around -2°C within 30 minutes. With continued sunlight, the interface between the panel surface and the ice will melt first, forming a water film only a few microns thick. This water film will cause the ice adhesion to plummet from 1.0 MPa to below 0.1 MPa within 10-15 minutes.
Time Estimation: For an ice layer 3 mm thick, after 10 AM on an unobstructed day, it typically takes 45 to 90 minutes of continuous sunshine to achieve overall sliding. Although the inverter has no output during this waiting period, this process is the most thorough maintenance for the modules.
If You Really Can't Wait, How to Help Safely
1. Targeted Pouring of Low-Concentration Salt Water: Prepare warm salt water (about 15-20°C) with a concentration below 5%. This concentration has a freezing point of about -3°C, which can melt ice without corroding the aluminum frame and silicone seals due to high salt content. When operating, use a spray bottle to pour only 100-200 milliliters targeted at the seam between the bottom edge of the panel frame and the ice layer. After the salt water contacts the ice, a melting gap should appear at the seam within 1-2 minutes.
2. Using Ambient Hot Air: If you have a household heater, fix its air outlet (temperature typically 40-50°C) at a distance of 1.5-2 meters from the bottom edge of the panel, blowing upward at a 45-degree angle for 15-20 minutes.
List of Absolutely Prohibited Actions and Their Physical Consequences
l Strictly Prohibit Striking: A single cell is only 180-200 microns thick, with limited bending strength. The impact force generated by striking the ice with a tool propagates through the glass and cells as stress waves, forming micron-level cracks inside the brittle silicon. One successful strike has a 30% chance of immediately causing visible cracks and a 40% chance of producing at that time invisible micro-cracks that gradually expand with thermal cycling.
l Strictly Prohibit Splashing Hot Water: Tempered glass can withstand very high uniform temperatures (above 300°C) but has poor resistance to severe temperature gradients. When hot water >60°C is splashed onto glass at -10°C, the glass surface instantly heats up and tries to expand, while the underlying layer remains contracted. The resulting thermal stress can easily exceed its 40 MPa tensile strength limit, causing the glass to "thermally shatter" completely, scrapping the entire module.
Design Tips to Reduce Icing from the Root
l Tilt Angle Optimization: In areas with frequent freezing rain, increase the installation tilt angle from the power-optimal angle (e.g., local latitude) by 5-10 degrees. When the tilt angle is ≥35 degrees, freezing rain tends to drip off due to its own weight before forming a continuous ice sheet, making it difficult to adhere.
l Ice-Phobic Coating: Before construction, inquire about the availability of an ice-phobic coating option. This type of nano-coating can reduce ice adhesion by over 50%, making the ice layer more likely to fall off entirely with slight temperature differences. The effective period of one application is typically 3-5 years.
l Module Pre-Heating (High-End Solution): For large power stations, a pre-heating system with DC power consumption less than 1% of the module power can be configured. By applying a tiny reverse current through the inverter in the early morning, the panel surface temperature is maintained around 0°C, preventing freezing rain from icing at the source. This system can recover about 8-15% of winter power generation losses.
Periodic Inspection and Performance Monitoring
In cold climates, the performance degradation rate of a solar system may be 15%-30% faster than in temperate regions, due to repeated freeze-thaw cycles, moisture ingress, and potential micro-crack propagation.
A system that ignores monitoring may have an actual total power generation over 25 years that is 20% lower than expected, extending the investment payback period from 8 years to over 10 years.
Effective monitoring is not just about checking daily generation; it's about using data trends to predict early signals of problems like PID effect, hot spot degradation, and junction box failure, shortening the maintenance response time from "months" to "days," and avoiding 5-8% of annual power generation losses.
What to Look at for Two Minutes Each Day: Three Key Data Indicators
1. DC Voltage vs. Temperature Correlation Curve: Under clear sky conditions, compare the ambient temperature (obtainable from weather forecasts) with the string DC voltage. The voltage temperature coefficient for standard silicon modules is approximately -0.3%/°C. If the ambient temperature is -10°C, the open-circuit voltage of a string of 20 panels should be higher than under Standard Test Conditions (25°C) by approximately (25 - (-10)) * 0.3% * string rated voltage. If the measured voltage consistently falls more than 5% below this calculated value, it indicates abnormal output from individual modules within the string or excessive line loss.
2. Current Balance Between Strings: When solar irradiance is stable (e.g., 11 AM - 1 PM), record the DC current values of each parallel string under the same inverter. Normally, the current difference between strings should be less than 3%. If one string's current is consistently 8% lower than the others, it is highly likely that 1-2 modules in that string are partially shaded (e.g., by snow, bird droppings) or have performance degradation.
3. Peak Power to Irradiance Ratio: Record the maximum AC output power (kW) during the day and query the local solar irradiance (W/m²) at that moment (some advanced monitoring systems integrate this data). Calculate the ratio of actual power to (total module rated power × real-time irradiance/1000). In the first 1-2 years of system operation, this ratio (comprehensive efficiency) should stabilize between 85%-92% (after deducting inverter loss, line loss, etc.). If this ratio drops by more than 2 percentage points for a consecutive week under similar weather conditions, it is a clear signal that the system needs a deep inspection.
Monthly On-Site Inspection Checklist (Completed in 10 Minutes)
No need to climb onto the roof; perform a visual inspection using binoculars or a mobile phone telephoto lens (optical zoom ≥10x).
l Focus on Hot Spots: While the system is generating normally (sunny noon), scan the panel surface with an infrared thermal imager (an external one for phones is sufficient). Any area with a temperature difference exceeding 20°C from surrounding cells is a "hot spot", usually caused by micro-cracks, internal diode conduction, or severe soiling. The power of this module has already degraded by 15% or more and will accelerate backsheet aging.
l Check Junction Boxes and Cables: Focus on the DC cable connectors (MC4 connectors) between modules and from strings to the inverter. Gently shake the connectors by hand (wear insulated gloves) to check for signs of burning, deformation, or hot spots more than 10°C above ambient temperature. Loose or corroded connections increase connector resistance, causing continuous heating at that point, power loss of 3-5%, and a fire risk.
l Observe Backsheet Color: The backsheet of monocrystalline modules (especially white) should be uniformly colored. If localized yellowing, blistering, or micro-cracks appear, it indicates moisture ingress, and the insulation performance of the internal cells is declining; the system leakage current may exceed standards.
Quarterly Deep Data Analysis
l Plot a "Power vs. Temperature" Scatter Chart: Plot the daily maximum power against the daily average temperature. Under normal conditions, it should show a clear linear negative correlation (higher temperature, slightly lower power). If the graph shows many discrete points below the fitted curve (i.e., abnormally low power even at low temperatures), these usually correspond to days with snow, soiling, or faults.
l Calculate the Performance Ratio (PR): PR = (Actual Energy Generated / (Module Nominal Power × Local In-Plane Irradiation)). The monthly PR fluctuation range for a healthy system should be less than ±3%. If the PR shows a continuous downward trend for 3 consecutive months, even if it only drops 0.5% per month, it strongly suggests the system has a progressive fault, such as PID effect or decreased transmittance of encapsulant materials.
Build Your Own Maintenance Archive
l Date, Weather Summary, Daily Generation (kWh), Peak Power (kW), Remarks (e.g., "Cleared snow at 9 AM, system restored to full power by 10 AM", "Found current low in 3 strings, inspection revealed snow on eastern edge").
l After consistently recording for 6 months, you will be able to accurately predict generation losses under different snow conditions and determine the optimal economic threshold for snow removal (e.g., don't clear snow below 5 cm, clear immediately if above), reducing maintenance time costs by 40%.