Do solar panels directly power your house
Yes, solar panels can directly power a house.
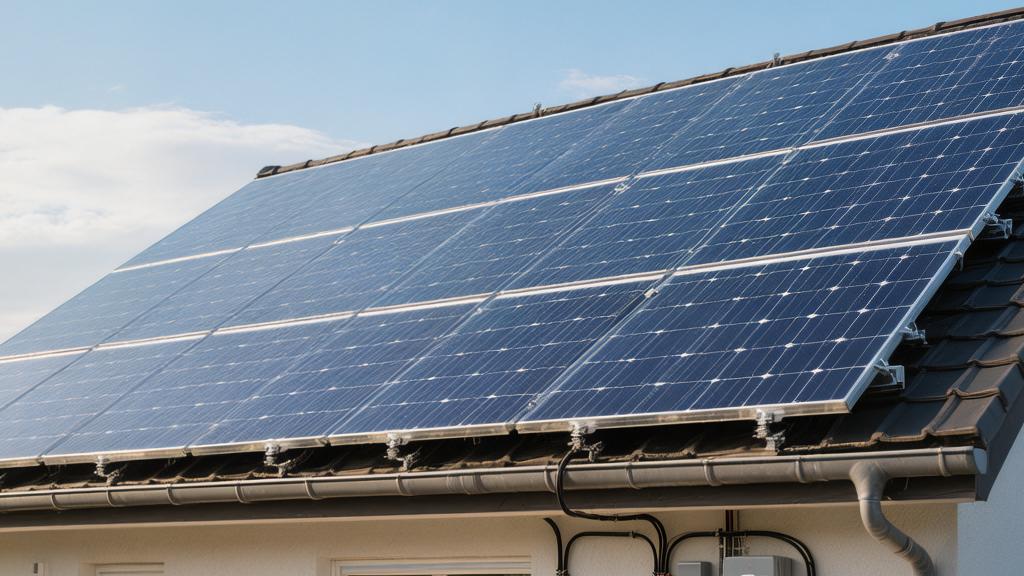
During the day, panels absorb sunlight to generate direct current (DC), which is then converted in real-time by an inverter (with conversion efficiencies usually exceeding 95%) into the alternating current (AC) required by home appliances for your direct use.
If real-time power generation is in surplus (for example, the system is producing 5 kW while your home only consumes 2 kW), the excess electricity is automatically fed into the public grid in exchange for bill credits (known as Net Metering policies), or stored in your home energy storage cell for nighttime use.
How They Work
Power from Light
Sunlight passes through 3.2 mm thick low-iron ultra-clear patterned tempered glass, with a light transmittance reaching over 93.5%.
Photons carry energy and strike the surface of monocrystalline silicon wafers, where the bandgap width of the silicon material is set at 1.12 electron volts (eV).
When visible and near-infrared light with wavelengths between 300 nm and 1100 nm shines, photons with energy higher than 1.12 eV will knock out electrons from the outer orbits of silicon atoms.
A square silicon wafer with a side length of 182 mm (M10 specification) generates a free electron flow of approximately 9 amperes under Standard Test Conditions (STC) of 1,000 W/m².
The movement of electrons breaks the original charge balance, establishing a potential difference of 0.68 V to 0.73 V across a single cell in an open-circuit state.
· For every 100 W/m² increase in light intensity, the short-circuit current increases linearly and proportionally by about 0.9 amperes.
· The increase in operating voltage remains within a logarithmic fluctuation range of 0.02 V.
· When the surface temperature is maintained at the 25°C baseline, the charge separation efficiency reaches its maximum peak.
Internal Junction
The manufacturing process diffuses phosphorus atoms into the surface of P-type silicon wafers with a thickness of 130 μm to 150 μm, with a doping concentration reaching the level of 10^19 atoms per cubic centimeter, forming an N-type emitter about 0.3 μm thick.
The P-type region is doped with boron atoms, with the concentration maintained at 10^16/cm³.
A space charge region (P-N junction) with a width of about 1 μm is formed at the interface, generating an internal electric field with an intensity of 10^4 V/cm.
Electrons excited by photons move toward the N-region at a drift velocity of about 10^5 cm/s under the action of the internal field, while holes are forced toward the P-region.
The surface undergoes alkaline texturing to form an inverted pyramid light-trapping microstructure with a base width of 2 μm to 5 μm, reducing surface physical reflectivity from over 30% to below 10%.
· The silicon wafer surface is covered with a silicon nitride (SiNx) anti-reflection passivation layer with a thickness of 75 nm to 80 nm.
· Light reflectivity is further suppressed to a range of 1.5% to 2.5%.
· Surface recombination rates drop significantly, and internal quantum efficiency rises to over 98%.
Collecting Current
Silver paste fine grid lines with a width of 30 μm to 40 μm are printed on the surface of the silicon wafer, with each cell containing 11 to 16 busbars.
The cross-sectional area of a busbar is around 0.05 mm², and the resistivity is lower than 3×10^-6 Ω·cm. Free electrons move laterally 2 to 3 mm along the fine grid lines to enter the busbar, and are then led out through copper ribbons coated with tin-lead alloy (width 0.6 mm to 1.0 mm, thickness 0.2 mm to 0.3 mm).
144-cell half-cut module technology uses lasers to cut a complete 182 mm cell into two halves of 182 mm × 91 mm along the centerline, halving the physical operating current from 13 A to approximately 6.5 A.
· According to Joule's law (P=I²R), energy loss from internal series resistance drops by 75%.
· The overall DC output power of a single module increases by 5 W to 10 W.
· The fill factor (FF) of the module remains stable in the range of 80% to 82%, ensuring the squareness of the output current waveform.
Heat and Shade Sensitivity
The output performance of the cell is negatively correlated with the operating temperature; the power temperature coefficient of monocrystalline silicon modules is -0.35%/°C.
Taking the standard environmental test temperature of 25°C as a baseline, when the actual working surface temperature of a roof in summer reaches 65°C, the 40°C temperature difference leads to a 14% drop in absolute output power.
The open-circuit voltage temperature coefficient is approximately -0.27%/°C, causing the voltage to drop from a rated 41.5 V to about 37 V under high-temperature conditions.
If 10% of the module's surface area is shaded by leaves or building shadows, the shaded solar cell instantly becomes a power-consuming load due to the internal series circuit structure, and local hot spot temperatures can soar to 150°C within 3 minutes.
· Three bypass diodes with a rated current of 20 A are installed in parallel within the junction box.
· The forward voltage drop of the diodes themselves is extremely low, maintained between 0.4 V and 0.45 V.
· When reverse bias exceeding the safety threshold is detected, the diode conducts within 5 microseconds, physically bypassing the shaded string of 50 cells.
Core Mechanism
Chopping Direct Current
The DC voltage input from a rooftop solar array to the base layer is usually maintained within a physical range of 300 V to 500 V.
Since household appliances are designed to receive AC power at 50 Hz or 60 Hz with a root mean square (RMS) value of 230 V, it must undergo physical truncation conversion via Insulated Gate Bipolar Transistors (IGBT) or Silicon Carbide (SiC) MOSFETs.
Internal switches perform opening and closing actions at an extremely high frequency of 16,000 to 32,000 times per second (16 kHz - 32 kHz).
The turn-on time of a single IGBT is compressed to 50 ns to 100 ns, and the turn-off time is below 150 ns.
Continuous switching actions "chop" the steady incoming continuous DC voltage into a series of high-frequency square wave sequences with varying pulse widths; the peak voltage is pumped up and fixed at a DC bus voltage level of about 400 V to 600 V.
The Sinusoidal Pulse Width Modulation (SPWM) process physically produces switching harmonics with frequencies as high as 16 kHz or more. High-frequency modules account for 15% to 20% of the total energy. If left unmanaged, this will cause severe heating in inductive loads, with the stator winding temperature rising at a rate of 12°C per minute, significantly shortening the insulation life of appliance motors.
Finding Maximum Output
As sunlight intensity climbs from 100 W/m² in the early morning to 1000 W/m² at noon, the voltage and current output of the photovoltaic panels fluctuate non-linearly.
The Perturb and Observe (P&O) algorithm built into the microprocessor actively fine-tunes the operating voltage at a frequency of 10 to 20 times per second.
The fine-tuning step size is set between 0.5 V and 1.0 V. When the calculated current output power (P=U×I) is greater than that of the previous sampling cycle, the microprocessor continues to apply a 0.5 V voltage perturbation in the same direction;
If a decrease in power is calculated, it immediately reverses the perturbation direction within 50 milliseconds.
The MPPT (Maximum Power Point Tracking) controller maintains a static tracking accuracy of 99.9% and a dynamic tracking accuracy exceeding 99.5%, ensuring that within one second of light dropping from 800 W/m² to 200 W/m² due to passing clouds, it instantly captures the current optimal operating voltage point to prevent a catastrophic drop in output power, recovering at least 15% to 25% of potential energy loss.
Filtering the Sine Wave
The high-frequency pulse square waves generated by the front-end circuit contain a large amount of high-order harmonics and must pass through an LCL low-pass filter composed of inductors (L) and capacitors (C).
Customized filter inductor parameters are set between 2.2 mH and 4.7 mH, and the core material uses high-permeability Kool Mμ magnetic powder cores with a saturation flux density as high as 1.05 Tesla (T).
AC filter capacitor capacity is configured at 10 μF to 22 μF, with a rated voltage handling 630 V AC.
When pulse square waves pass through the inductor coil, high-frequency currents above 1,000 Hz are physically blocked, generating a voltage drop loss of about 2 V to 5 V;
After double filtering, the total harmonic distortion (THD) of the output current is forced below 3%, with waveform smoothness superior to the 5% tolerance limit specified by the utility grid itself, outputting a pure 230 V RMS sine wave with a peak voltage stable at 325.26 V.
Energy loss in the filter circuit during full-load operation accounts for about 30% of total conversion loss, and the surface temperature of the inductor coil will rise to 70°C to 85°C. The heat sink area of the casing usually needs to reach 0.5 to 0.8 square meters to carry away approximately 150 W to 250 W of waste heat per hour via natural convection.
Aligning with the Grid
Before merging the converted AC power into the home's main distribution box, the microcontrol unit (MCU) continuously monitors the waveform of the external utility power via Phase-Locked Loop (PLL) technology.
Voltage sampling sensors read grid voltage data at a rate of 10,000 times per second, calculating precise phase angles and real-time frequency.
The internally generated AC waveform is forced into phase synchronization, with phase error tolerance locked within 0.1 degrees.
To allow current to flow smoothly from the inverter to home appliances or back into the public grid, the RMS value of the AC voltage output by the equipment must be actively raised, typically 1.5 V to 3.0 V higher than the real-time grid voltage.
This artificially created minor potential difference drives the current to overcome the physical resistance of the cables (usually between 0.05 Ω and 0.2 Ω) according to Ohm's law, injecting current into the home AC bus at a rated current of 5 A to 20 A.
Frequency synchronization accuracy must be maintained within a narrow window of 50.00 Hz ± 0.05 Hz or 60.00 Hz ± 0.05 Hz. Once the deviation exceeds 0.2 Hz, built-in protection relays will physically disconnect the connection within 20 milliseconds.
Need Concerns
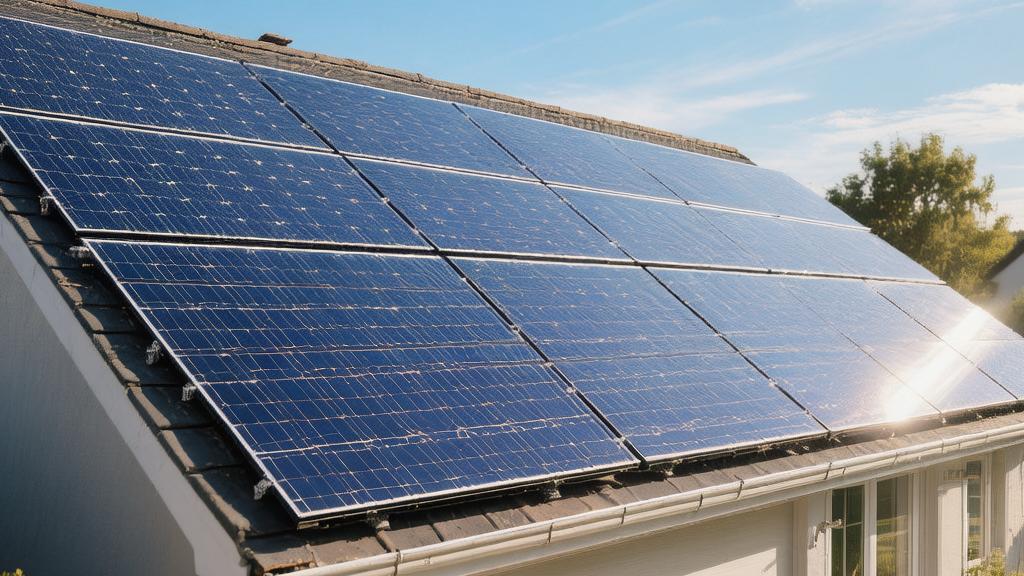
Is the Roof Suitable
Installing a 6 kWp photovoltaic system typically requires 14 monocrystalline modules with a power of 430 W to 450 W.
The physical dimensions of each module are approximately 1722 mm × 1,134 mm × 30 mm, with a single weight between 21 kg and 24 kg.
This means the roof needs to bear a static load of about 330 kg, distributed over a projected area of about 28 square meters.
The bracket system must use 6005-T5 aluminum alloy or hot-dip galvanized carbon steel, with a thickness of no less than 2.0 mm.
In coastal high-wind areas, the brackets must be able to withstand a wind pressure load of 2400 Pascals (Pa), which is equivalent to resisting a strong typhoon above level 12 (wind speed approx. 32.7 m/s).
If the roof tiles have been in use for more than 15 years, or if the waterproof layer thickness is less than 3 mm, reinforcement costs before installation will account for 10% to 15% of the total budget.
Orientation issues have an absolute impact on power generation; in the Northern Hemisphere, true south (azimuth 180°) is the reference point.
If forced by the roof structure to turn toward the east or west (azimuth deviation of 90°), the system's annual power generation will directly decay by 15% to 20%.
Installation tilt is usually set within ±5 degrees of the local latitude to obtain the maximum total annual radiation.
For example, in an area at 30 degrees latitude, when the tilt is set to 25 to 35 degrees, the total annual solar radiation received per unit area can reach over 1400 kWh/m².
Shading is the "invisible killer" of system power. Because the internal modules use series circuits, even if only 5% of the surface area is shaded by trees or utility poles, the output power of the entire branch may plummet by 30% to 50%.
Leakage is No Joke
When the solar array is running, the DC side voltage is usually between 300 V and 600 V, and high-end residential systems may even reach 1000 V DC.
Unlike AC, DC has no zero-crossing point; once an arc fault occurs, the flame temperature will rapidly rise to over 3000°C.
Therefore, the inverter must integrate Arc Fault Circuit Interrupter (AFCI) functions compliant with the UL1699B standard. The system must automatically cut off the circuit within 800 milliseconds after detecting an arc.
DC cables must be specialized solar cables (such as PV1-F 1×4 mm²), and their insulation layer must have ultraviolet (UV) resistance, with a design life of over 25 years.
The protection level of the junction box must reach IP68 to ensure no leakage after being continuously immersed in water at a depth of 1.5 meters for 30 minutes.
System grounding resistance must be controlled below 4 ohms (Ω) to prevent lightning-induced currents from burning out the motherboard.
Risk Parameter | Safety Threshold | Potential Impact |
DC Side Voltage | 600 V - 1000 V | Contact produces fatal electric shock; sparks are difficult to self-extinguish |
Arc Cut-off Time | < 0.8 seconds | Exceeding this time easily ignites roof waterproof coatings |
Insulation Resistance to Ground | > 1 MΩ | Below this value, the inverter will report a leakage fault and shut down |
Leakage Current Protection | 30 mA - 300 mA | Critical point for protecting the human body and preventing electrical fires |
Gloomy Days are Frustrating
The nominal power of solar panels is measured under standard light of 1,000 W/m², but actual environmental fluctuations are massive.
In cloudy weather, scattered radiation from the atmosphere may drop to only 100 W/m² to 200 W/m², at which point the power output efficiency will drop below 15% of the rating.
In cases of heavy rain or severe smog, where vertical visibility is below 500 meters, the weak current generated by the modules may not even maintain the inverter's startup self-check power consumption (usually 10 W to 50 W), causing the system to enter standby mode.
In winter, sunlight hours may shorten from 12 hours in summer to 8 hours, and the lower solar altitude angle results in a 40% drop in effective irradiance.
This means that a system generating 30 kWh per day in summer might only produce 12 kWh per day in winter.