How Do the Prices of Monocrystalline and Polycrystalline Solar Cells Compare?
Monocrystalline cells cost 20-30% more upfront (0.22−0.27/Wvspoly’s0.17-0.21/W) but offer 22-25% efficiency (vs poly’s 18-22%); their higher output slashes levelized energy cost (LCOE) by 5-8% over 25 years, justifying the premium for long-term ROI.
Upfront Cost per Watt
When you're budgeting for a solar panel system, the first number you'll often see is the price per panel. However, a 400-watt panel and a 300-watt panel at the same price represent very different values.
This Czochralski process is more energy-intensive and complex, which adds approximately 5-10% to the base manufacturing cost. This fundamental efficiency difference is key: a standard 60-cell polycrystalline panel might have a power rating around 330-350 watts, while a similarly sized 60-cell monocrystalline panel routinely achieves 370-390 watts.
Feature | Monocrystalline | Polycrystalline |
Average Price per Watt ($/W) | 0.15−0.25 | 0.10−0.20 |
Typical 60-Cell Panel Wattage | 370W - 390W | 330W - 350W |
Efficiency Range (%) | 20% - 23% | 16% - 18% |
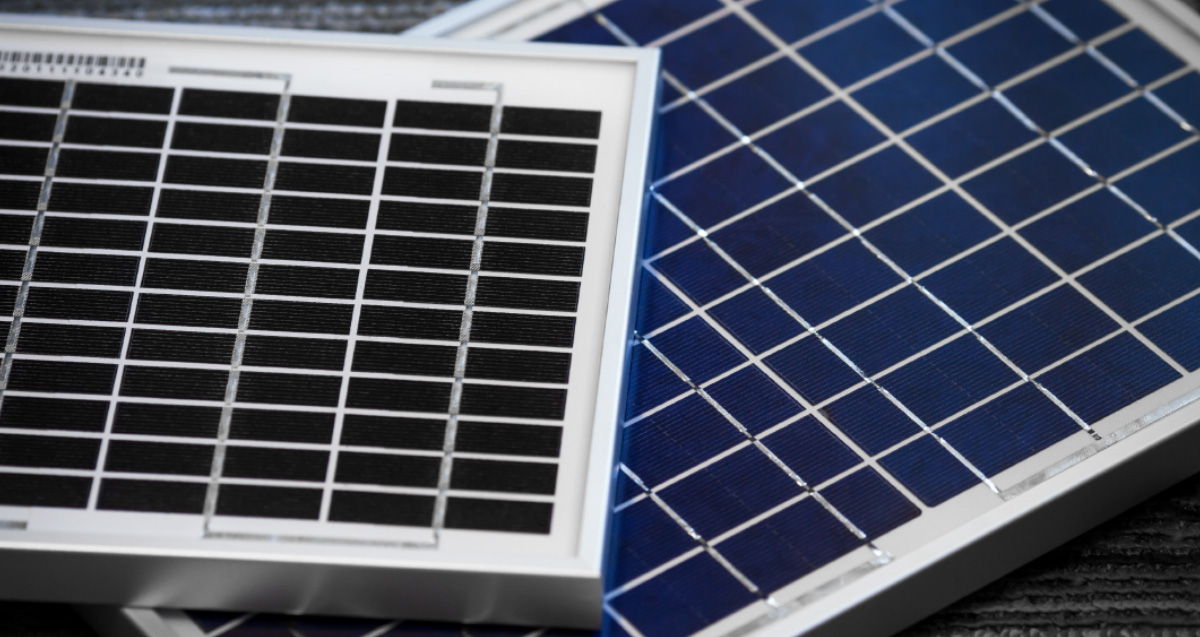
Space Efficiency | High. Requires ~15% less roof space for the same system size. | Lower. Needs more panels and more roof space. |
Therefore, while polycrystalline panels appear cheaper on a per-unit basis, the total installed cost difference can narrow significantly. If your roof space is limited or has complex shading, the higher power density of monocrystalline panels can lead to a more powerful system overall for a similar final price.
Long-Term Value and Efficiency
A panel's long-term value is a function of its power generation efficiency and its rate of degradation over a typical 25- to 30-year lifespan. A cheaper panel that produces less energy and loses its capacity faster can ultimately be more expensive than a higher-efficiency, more resilient option. Monocrystalline panels consistently hold an advantage here, starting with a higher efficiency rating—typically 20% to 23% for modern mono panels versus 16% to 18% for polycrystalline models.
High-quality monocrystalline panels often come with a degradation rate of 0.3% to 0.5% per year. Polycrystalline panels tend to degrade slightly faster, at a rate of 0.5% to 0.7% annually. After 25 years, a mono panel with a 0.4% annual degradation will still operate at about 90% of its original output. A poly panel with a 0.6% annual rate will be at approximately 85%. On a 10 kW system, that 5% difference in remaining output translates to 500 watts of lost generation capacity two decades later, which can represent a meaningful amount of electricity you'd need to buy from the grid.
Monocrystalline panels generally have a better (lower) temperature coefficient, around -0.30% to -0.35% per °C. Polycrystalline panels are often in the range of -0.40% to -0.45% per °C. On a hot, sunny day when panel surface temperatures can reach 65°C (149°F), a monocrystalline panel will experience a ~3-4% smaller drop in performance. Over 25 years in a warm climate, this better heat tolerance can result in 2-4% more total energy production.
Long-Term Performance Factor | Monocrystalline | Polycrystalline |
Initial Efficiency Range (%) | 20% - 23% | 16% - 18% |
Typical Annual Degradation Rate | 0.3% - 0.5% | 0.5% - 0.7% |
Expected Output after 25 Years | ~89% - 92% | ~83% - 87% |
Typical Temperature Coefficient (/°C) | -0.30% to -0.35% | -0.40% to -0.45% |
Studies have shown that solar installations can increase a home's value by an average of 4.0%. A more efficient and reliable system can be a stronger selling point. When evaluating long-term value, the Levelized Cost of Energy (LCOE)—the average net present cost of electricity generation over the system's lifetime—is the ultimate metric.
Silicon Quality and Manufacturing
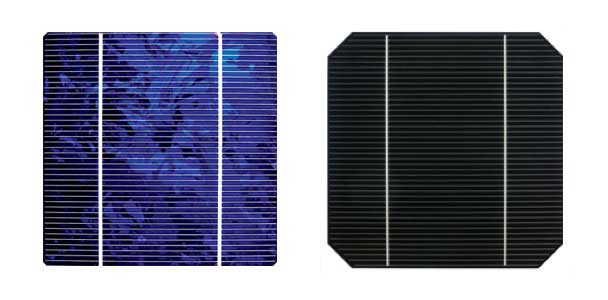
Monocrystalline silicon is produced using the Czochralski (CZ) method, where a seed crystal is slowly withdrawn from a vat of molten silicon (99.9999% pure) at a temperature of approximately 1420°C (2588°F). This meticulous process, which can take over 72 hours for a single large ingot, results in a perfectly ordered, cylindrical crystal structure with virtually no grain boundaries. This atomic uniformity allows electrons to flow with less resistance, which directly translates to the higher initial efficiency of 20-23%.
The Czochralski process for monocrystalline silicon has an energy intensity of approximately 45-55 kWh per kilogram of silicon, a significant contributor to its higher cost base compared to the casting process.
Raw silicon is melted in a rectangular quartz crucible at around 1410°C (2570°F) and then allowed to cool and solidify over a period of 20-36 hours. The boundaries between these grains impede the flow of electrons, which is the primary reason for polycrystalline's lower efficiency, typically peaking at 16-18%. The casting process has a lower energy input, around 25-35 kWh per kilogram, and a higher material yield, as the rectangular bricks minimize waste when sliced into square wafers.
While PERC can be applied to polycrystalline cells, the performance gain is often less pronounced, around 0.5-0.8%, due to interference from grain boundaries. Furthermore, the controlled structure of mono silicon leads to a more consistent and predictable annual degradation rate of 0.3-0.5%, as there are fewer inherent structural defects for impurities like boron and oxygen to interact with over time. The more complex grain structure of polycrystalline silicon can lead to a slightly higher and more variable degradation rate, averaging 0.5-0.7% per year.
Market Trends and Price Changes
In 2015, polycrystalline panels dominated with a 55-60% market share, thanks to their compelling cost advantage. At that time, mono panels carried a significant 20-25% price premium. However, by 2023, the landscape had flipped entirely. Monocrystalline technology now commands an 85-90% share of new utility-scale and residential installations worldwide. This seismic shift wasn't due to a sudden change in the fundamental physics of silicon, but rather a convergence of manufacturing advancements and economies of scale that have dramatically narrowed the price gap to just 10-15%, making mono's efficiency benefits more accessible than ever.
The transition from the old 156mm (M2) wavers to the now-dominant 182mm (M10) and 210mm (G12) formats was led by mono producers. These larger wafers yield panels with higher wattage—a standard panel now produces 450-550 watts, compared to 250-350 watts a decade ago—which reduces balance-of-system costs per watt.
As major manufacturers shifted production lines to mono, the poly supply chain scaled down. This has led to a 15-20% faster annual price depreciation for poly inventory compared to mono. While this makes existing stock seem like a bargain, it also signals a technology approaching obsolescence.
Several key factors are currently influencing market prices for both types:
l Raw Material Costs: The price of polysilicon, the base material, is highly volatile. A price spike from 10/kgto35/kg in 2021-2022 affected all panels, but mono's higher silicon purity requirements made it slightly more sensitive to these fluctuations.
l Technology Adoption: The rapid integration of high-efficiency monocrystalline-based technologies like PERC, TOPCon, and HJT has created a two-tier market. Premium "N-type" mono panels (e.g., TOPCon) now carry a 5-10% premium over standard "P-type" mono, which themselves are only marginally more expensive than polycrystalline panels.
l Supply Chain Dynamics: Trade policies, such as tariffs on imported panels, can instantly alter local market prices. For example, tariffs can add a 15-25% surcharge on certain imports, which can sometimes make domestic poly panels price-competitive with imported mono panels in specific regions.
The market is now focusing its innovation on advancing mono-PERC and N-type technologies, with projections suggesting the price gap could narrow to under 5% by 2026, potentially making polycrystalline a niche product for specific, budget-constrained projects.
Installation and Maintenance Costs
A system using higher-efficiency monocrystalline panels will require fewer panels, less racking hardware, and less labor to achieve the same power output as a system using polycrystalline panels. This efficiency can lead to tangible savings on installation day and throughout the system's 25-30 year lifespan, potentially offsetting the panels' higher initial purchase price.
A typical residential system size is around 6 kilowatts (kW). To achieve this with 340-watt polycrystalline panels, you would need approximately 18 panels. Using 400-watt monocrystalline panels, you would only need 15 panels. This reduction of 3 panels translates into measurable savings:
l Labor Time: Installers typically mount 8-12 panels per day. Fewer panels reduce labor time by 1-2 hours, saving 100−250 in labor costs.
l Racking and Mounting Hardware: Each panel requires its own set of clamps and rails. Fewer panels mean less material. This can reduce racking costs by 5−10 per panel, totaling 75−150 in savings for the example above.
l Electrical Modules: Fewer panels also mean fewer branch connectors and slightly less wiring, potentially saving another 50−100.
Because monocrystalline panels have a higher power density, a layer of dust or dirt that reduces output by 5% represents a greater absolute loss of energy (watts) than the same layer on a less efficient polycrystalline panel. This can create a slightly higher financial incentive to clean mono panels more frequently to maintain peak production. However, both types benefit from the same cleaning regimen—typically 1-2 times per year—with a professional cleaning costing 150−300 per service.
Cost Factor | Monocrystalline | Polycrystalline |
Panels Needed for a 6 kW System | 15 x 400W panels | 18 x 340W panels |
Estimated Labor & Racking Savings | 225−500 (baseline) | - |
Degradation-Induced "Cost" over 25 yrs | Lower (~0.4%/yr). Loses ~10% of output. | Higher (~0.6%/yr). Loses ~15% of output. |
Impact of Shading | Higher efficiency per panel means shading one panel has a greater relative impact on total system output. | Lower efficiency per panel can sometimes make the system slightly more resilient to the impact of shading a single unit. |
As discussed earlier, polycrystalline panels' higher average degradation rate of 0.6% per year versus 0.4% for mono means that after 10 years, the poly system's output will be approximately 2% lower than the mono system.
Choosing Based on Your Budget
The once-large price gap has narrowed to a 10-15% difference in upfront cost, making the choice less about absolute affordability and more about value optimization over a 25-year period.
A 6.6 kW mono system might require 16 x 415W panels, while a comparable poly system might need 20 x 330W panels. This reduction of 4 panels can save 400−800 on installation soft costs, effectively cutting the price premium of mono from 15% to just 5-7%. When you factor in the 0.4% versus 0.6% annual degradation, the mono system will generate 3-5% more electricity over its lifetime, easily outweighing the minimal final price difference.
Budget & Scenario Consideration | Recommended Technology | Rationale & Financial Impact |
Tight Budget, Ample Roof Space | Polycrystalline | Maximizes initial system size (kW). A $20,000 budget might buy a 9.5 kW poly system vs. an 8.3 kW mono system. |
Constrained Roof Space | Monocrystalline | Higher wattage/panel maximizes energy production. Fitting a 6 kW system on a small roof may only be possible with mono. |
Goal: Maximum 25-Year ROI | Monocrystalline | Higher initial output + slower degradation yields a lower Levelized Cost of Energy (LCOE), often 2-4% less over the system's life. |
High Electricity Rates (>$0.25/kWh) | Monocrystalline | The value of each extra kWh generated by mono's higher efficiency is greater, accelerating payback by 6-12 months. |
Long-Term Home Ownership (15+ yrs) | Monocrystalline | The ~5% higher end-of-life output (Year 25) protects against future energy price inflation more effectively. |
In this case, the 3-5% greater annual production from a mono system directly translates to a 3-5% larger credit on your bill. For a household with an annual energy consumption of 12,000 kWh, that difference of 360-600 kWh per year, at a rate of 0.20/kWh ,amounts to 72-120 in annual savings. Over 25 years,that’s an extra 1,800-$3,000 in value, far exceeding the modest upfront price difference.