How often do solar panel need to be replaced
Solar panels typically do not require frequent replacement, with a designed lifespan generally between 25 to 30 years.
Most tier-1 brands (such as LONGi and Trina Solar) provide a power warranty of 25 years, meaning that after 25 years of use, the power generation efficiency of the panels can still be maintained at more than 80% to 85% of the initial power.
While panels do not suddenly "stop working" after 30 years, their power generation will decrease at a rate of approximately 0.5% per year.
If your electricity expenses increase significantly due to insufficient power generation, or if the inverter (which typically has a lifespan of only 10-15 years) fails, you may need to consider partial replacement or an overall upgrade.
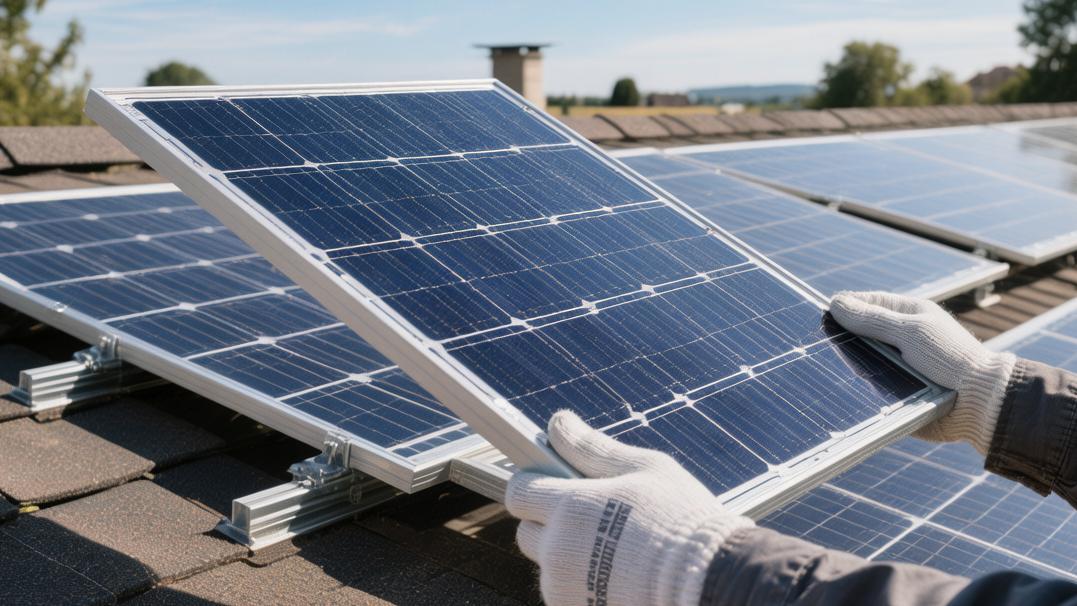
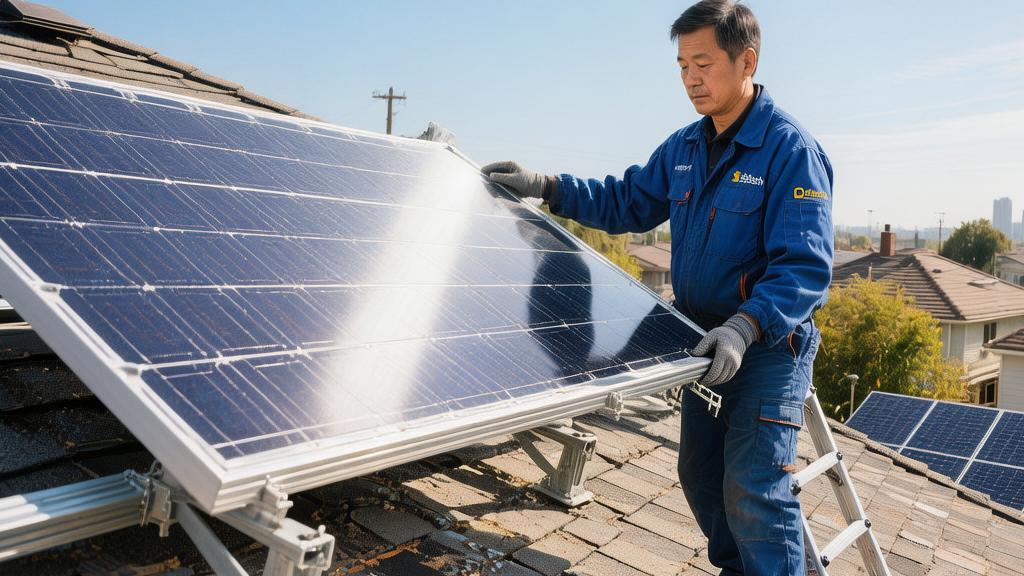
It is recommended to have a professional inspection every 3-5 years and keep the surface clean to ensure it delivers maximum value throughout its lifecycle.
Lifespan vs. The Warranty
How long it can last
The physical lifespan of monocrystalline silicon modules installed on roofs is usually between 35 and 40 years.
The equipment material warranty provided by manufacturers is generally only 10 to 12 years. During the first 120 months of the work cycle, if the aluminum alloy frame breaks or water enters the back glass, the hardware cost to replace new parts is 0 USD.
A sampling test of 10000 rooftop installation cases by the U.S. Department of Energy shows that the probability of a complete system shutdown due to manufacturing process defects in the first 10 years of operation is only 0.05%.
When the equipment reaches its 15th year of operation, 36 months beyond the original material warranty, purchasing and replacing a 400 W panel yourself requires a cost of approximately 250 USD.
Even if the warranty contract is completely lost, this panel can still maintain more than 88% of its factory rated power when working continuously in the 200th month.
Many families spend an initial budget of 15000 USD to buy a 5 kW system; during the phase from the 15th to the 25th year without a product warranty, it can still guarantee a stable daily output of 18 to 22 degrees of AC power.
Degradation Ratio
The linear power warranty promised by photovoltaic manufacturers on product data sheets is as long as 25 years.
The contract terms specify that the decline in power generation in the 1st year after the module leaves the factory must not cross the red line of 2%.
From the start of operation in the 13th month until the 300th month, the rated power degradation rate for every 12 months is strictly limited to within 0.5%.
· Based on a system rated output power of 5,000 W, the minimum power generation load capacity on the day the 25-year period is reached must be 4,010 W.
· If the owner detects in the 18th year that the maximum output power at the inverter end has dropped to 3500 W, which is far below the 81% bottom line agreed upon in the contract.
· After triggering the performance claim clause, the manufacturer will ship a brand new 350 W module for free to fill that 500 W power generation gap.
· After receiving this free replacement module, the system can save approximately 85 USD in electricity bills annually over the next 84 months of its lifecycle.
· This 25-year commitment to the equipment performance floor exactly covers 83% of the operation time of the entire physical lifecycle of the photovoltaic array.
Paying Labor Costs
The 20 solar panels fixed side-by-side on the roof have a 25-year warranty, but the supporting inverter connected to the side has a lifespan of only 10 to 15 years.
A string inverter with a maximum capacity of 6 kW processes 8 hours of DC power conversion at full load daily; its internal capacitors reach physical fatigue limits after approximately 4000 high-temperature thermal cycles.
When the entire system continues to run for the 144th month, there is a 75% probability that the homeowner will need to spend 1200 USD to purchase a brand new inverter.
The manufacturer's panel warranty agreement notes in 12-point font that they only bear the hardware manufacturing cost of approximately 150 USD per module.
The professional labor cost of 75 USD to 150 USD per hour generated during the replacement of any parts in the later stage must be 100% paid by the customer in cash.
The total bill of 300 USD generated by two certified electricians climbing onto a two-story slanted roof for 120 minutes of disassembly and replacement work is completely outside the calculation range of that 25-year warranty clause.
Degradation Rate
Power Drop Speed
From the 1st hour, a monocrystalline silicon module with a nominal power of 450 W is installed on a roof bracket. Its internal boron-oxygen complex induces Light-Induced Degradation (LID) under light conditions, causing the output power in the first year to drop directly by 1.5% to 2.5%.
This means that by the 365th day, the actual peak capacity of this originally rated 450 W panel will shrink to about 438.7 W.
After passing this fluctuating first year of operation, the module enters a linear loss phase lasting 24 years, with the average annual power reduction rate maintained between 0.4% and 0.55%.
If your roof is installed with 22 such panels with a total installed capacity of 9.9 kW, after 1825 days of continuous operation, the maximum output load of the entire system will naturally drop to about 9.4 kW.
This irreversible physical performance decline is mainly due to the passivation layer on the surface of the silicon wafer experiencing more than 43,800 hours of natural light, increasing the recombination rate of its charge carriers by about 8% to 12%.
Which Technology to Choose
P-type PERC cells, which occupy 70% of the market share, usually have a total power degradation rate of about 19.2% over 25 years, while the latest generation of N-type TOPCon modules can reduce this value to 12.6%.
The natural advantage of N-type technology lies in its Light-Induced Degradation (LID) being near 0%, and within a 300-month lifecycle, the average annual degradation rate is only 0.4%, which is 0.15 percentage points lower than traditional P-type modules.
Assuming you arranged a 15 kW array on a 60 square meter roof, using N-type modules means that in the 240th month, you can produce 8.5 more degrees of AC power per day than using P-type modules.
Based on a unit price of 0.2 USD per degree of electricity, this 0.15% technical difference can accumulate about 1240 USD in additional cash income within 20 years.
For modules using Heterojunction (HJT) technology, the first-year degradation rate is even as low as 1%, and the output power after 25 years can still be maintained between 88% and 90% of the factory nominal value.
Weather Stress
For every 10 degrees Celsius increase in ambient temperature, the open-circuit voltage (Voc) of photovoltaic modules usually drops by about 2.3 V; this performance fluctuation caused by thermal fatigue results in an extra 1.2% power loss annually in tropical regions.
If the solar panel bears a forward pressure of more than 5400 Pa for a long time, such as under a snow cover thicker than 30 cm, the probability of micro-cracks occurring inside the silicon wafer will soar from 0.2% to 4.5%.
These fine scars, invisible to the naked eye, will increase the internal current transmission resistance by 15% to 20%, inducing a 25 degree Celsius temperature increase in the damaged area, forming a hot spot effect.
In areas where hourly wind speeds exceed 120 km/h, the mechanical deformation of the aluminum alloy frame will cause a 0.5 mm gap in the module sealant, increasing water vapor penetration in the air by 30%, thereby accelerating the oxidative corrosion of internal busbars by about 5%.
The decrease in power generation efficiency caused by this cumulative environmental stress in some high-humidity areas will be 0.2 percentage points more than under standard operating conditions annually.
Factors That Speed Up Aging
Too Hot
The ambient temperature under Standard Test Conditions (STC) is 25 degrees Celsius, but when the summer temperature soars to 38 degrees Celsius, the cell temperature inside the panel will quickly rush to 75 degrees Celsius or even higher because the black surface absorbs more than 90% of the light and heat.
According to the temperature coefficient parameters of photovoltaic modules, for every 1 degree Celsius increase, the output power usually drops by 0.3% to 0.45%.
This means that on one afternoon, an originally 400 W panel may only be able to output 320 W of effective power.
In long-term high-temperature cycles above 65 degrees Celsius, the ethylene-vinyl acetate (EVA) film encapsulating the cells will undergo thermal degradation, and transparency will decrease by 15% to 20% over a 240-month span.
This yellowing at the physical level leads to reduced light transmittance, resulting in a reduction in the number of photons entering the cell, directly lowering the power generation ceiling by about 5%.
If the roof ventilation gap is less than 10 cm, the bottom heat cannot be dissipated by convection, and the average annual natural degradation rate of the module will rise from the nominal 0.5% to over 0.85%.
Heavy Pressure
A set of modules meeting international standards can usually withstand 5400 Pa of forward static pressure and 2400 Pa of negative wind pressure.
However, in extreme weather, if the snow thickness exceeds 50 cm, the pressure per square meter will reach about 150 kg.
This continuous heavy pressure causes the silicon wafer, which is only 180 microns thick, to undergo deformation invisible to the naked eye.
These tiny cracks will cut off the current path inside the cell, increasing contact resistance by 5% to 15%.
According to infrared thermal imaging sampling analysis, areas with serious micro-cracks will produce local overheating during work, with temperatures 30 degrees Celsius higher than the surroundings.
After experiencing more than 50 strong wind vibration cycles annually, these cracks will expand at a rate of 10% per year, eventually leading to a power output in the 15th year that is more than 12% lower than the expected life curve.
Pressure Type | Standard Value | Extreme Load | Performance Loss Estimate | Physical Consequence |
Forward Static Pressure (Snow) | 5400 Pa | >8000 Pa | -12% Power | Large-scale wafer breakage |
Negative Wind Pressure (Strong Wind) | 2400 Pa | >4000 Pa | -8% Efficiency | Busbar solder joint detachment |
Dynamic Load (Vibration) | 1000 cycles | 5000 cycles | -5% Output | Linear expansion of micro-cracks |
High Humidity
Homeowners living within 10 km of the coastline need to face the risks of salt spray corrosion and potential Potential Induced Degradation (PID).
When the ambient humidity exceeds 85% for a long time, water vapor will penetrate into the module through the edge of the backsheet, which is only 300 microns thick.
The acetic acid produced after moisture reacts with the sealant will corrode the silver grid lines in the circuit, increasing the series resistance of the module by 0.5 ohms (Ω) to 2 ohms.
Under the action of a high-voltage electric field, charge will leak to the metal frame through the encapsulation material, triggering the PID effect.
This phenomenon is particularly evident in system architectures where the working voltage reaches 600 V to 1000 V.
Statistics show that old modules that have not passed anti-PID certification may suffer a power crash of up to 30% due to this charge loss within the first 36 months after installation.
By installing an anti-PID repair device for the inverter, although it costs an additional budget of about 500 USD, it can recover about 15% of the power loss over the next 20 years.