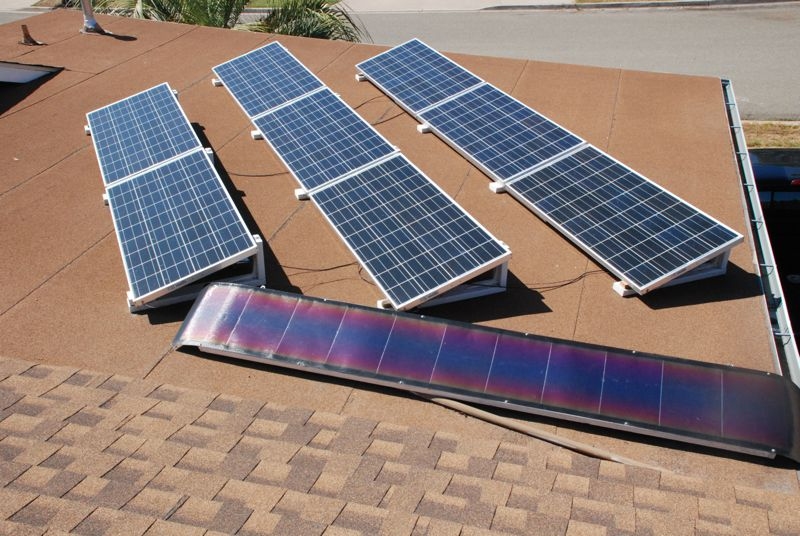
How do I choose my solar panels
It is recommended to prioritize N-type TOPCon panels with photoelectric conversion efficiency exceeding 20%.
Pay attention to single module power (such as 400W-550W) and Tier 1 (first-class) supplier rankings, and confirm that they have a linear power warranty of more than 25 years.
Efficiency
Efficiency Level
Under the standard light intensity of 1,000 W/㎡, the photoelectric conversion efficiency of monocrystalline silicon solar cells has increased from 15% ten years ago to over 22.5% today.
If you choose a module with 23.2% efficiency, it can produce a rated power of 450W in an area of 1.95 square meters, whereas a module with 20% efficiency can only produce 390W in the same area, which means the rooftop utilization rate differs by 15.38%.
Current mainstream N-type TOPCon solar cells reduce carrier recombination loss by adding a 1.5-nanometer-thick tunneling oxide layer, making the mass production efficiency about 1% to 1.5% higher than traditional P-type modules.
· After packaging 182 mm size M10 silicon wafers into 108-cell modules, the system voltage is usually maintained at around 1000 V.
· With 210mm size G12 large silicon wafers combined with a 132-cell layout, the single-piece power can easily exceed 660W, reducing bracket installation costs by 3%.
· If the module's Fill Factor can reach over 80%, it indicates extremely low internal resistance loss and higher current conduction efficiency.
Temperature Performance
The power of solar panels decreases as the temperature rises, which is determined by the temperature coefficient of -0.29%/℃ to -0.35%/℃.
Assuming the rooftop temperature reaches 75℃ in summer, which is 50℃ higher than the 25℃ test standard; if the coefficient is -0.3%, the power will evaporate by 15% instantly.
Laboratory data shows that N-type HJT heterojunction modules have a superior temperature coefficient of -0.24%/℃, generating 3% to 5% more electricity than ordinary monocrystalline modules in the same high-temperature environment.
· Maintaining a ventilation gap of more than 10 centimeters on the back of the panel can reduce the operating temperature by 5℃ to 8℃.
· For every 1℃ drop in operating temperature, a 10 kW system can recover about 30 W of power loss per hour.
· Since half-cut technology halves the current, internal heat loss is reduced by 75%, effectively alleviating the local hot spot effect.
Bifacial Gains
The rear-side gain of Bifacial modules is usually between 5% and 25%, depending on the ground albedo.
On a white-painted roof, the reflectivity is as high as 80%, and the rear side can contribute an additional 15% of electricity;
But on a dark asphalt roof, the reflectivity is only about 10%, and the rear-side gain will shrink to below 3%.
The Bifaciality Factor is the standard to measure this capability; the bifaciality of high-quality modules can reach 80% to 85%.
· Increasing the installation height by 0.5 meters can increase the amount of scattered light received on the back by about 12%.
· Using a 2.0mm+2.0mm double-glass encapsulation structure extends the lifespan by more than 5 years compared to a single-glass plus backsheet structure.
· In snowy environments, since snow reflectivity exceeds 90%, the instantaneous output power of bifacial modules can even exceed 120% of the rated power.
Low Light Response
The low-light response capability determines the power generation revenue from 6 to 8 AM and on cloudy or rainy days.
Since N-type cells do not have initial light-induced degradation (LID) caused by boron-oxygen complexes, they can still maintain a relative efficiency of over 95% under a low irradiation intensity of 200 W/㎡.
Through 16BB (Multi-Busbar) technology, the travel distance of the current on the fine grid lines is shortened, reducing the shaded area by 10% and lowering electrical losses.
· The spectral response range has extended from 300 nm to 1200 nm, covering more infrared band energy.
· On hazy days with PM2.5 concentrations exceeding 150, the average daily power generation of modules with high low-light response is 8kWh higher than that of ordinary modules (calculated for a 50kW system).
· Anti-PID (Potential Induced Degradation) performance tests require power degradation to be less than 5% after 192 hours of testing at 85℃ high temperature and 85% humidity.
Durability
The power warranty period is usually 25 to 30 years, and the degradation rate in the first year should be controlled within 1.0%.
If the annual linear degradation rate can be maintained at around 0.4%, it means that the module will still have 87.4% of its original power after 30 years.
If the annual degradation is 0.2% higher, over a 25-year cycle, a 6 kW system will generate 18000 fewer kWh in total. Calculated at a 0.15 USD electricity price, the loss amount is as high as 2700 USD.
· Using EPDM sealing strips can control the leakage current of the module below 0.1 mA.
· Passing the 5400Pa front snow load test and 2400Pa back wind load test ensures that the deformation is less than 2% under a level 12 gale.
· The three Schottky diodes inside the junction box need to carry a rated current of more than 20A to prevent circulation from burning the cells during shading.
System Losses
The efficiency of the entire system depends not only on the panels but is also restricted by the MPPT (Maximum Power Point Tracking) efficiency of the inverter, which is usually above 99.5%.
The DC side line loss needs to be controlled within 1%, which means the length of 4 square millimeter photovoltaic specific cables should not exceed 30 meters.
If one panel in the string has a 20% current drop due to shading, without an optimizer, the output of the entire string of 10 panels will be dragged down to the 80% level.
· Choosing a 1500V system voltage level reduces the number of strings by 33% compared to a 1000V system.
· If the inverter's Euro Efficiency reaches 98.2%, it can produce 12,000 kWh more electricity during its lifespan than an ordinary model with 97.5% efficiency.
· The system DC/AC Ratio is recommended to be set between 1.2 and 1.4 to ensure the inverter can still run at full load during periods of insufficient sunlight.
Temp. Coefficient
Heat Sensitivity
Panels are measured for rated power in the 25℃ Standard Test Conditions (STC) laboratory environment, but the actual operating temperature of the roof in summer is usually 30℃ to 35℃ higher than the ambient temperature.
When the air temperature reaches 40℃, the internal temperature of the cell will soar to 70℃ to 75℃, which is exactly 50℃ higher than the standard test environment.
If a module's power temperature coefficient is -0.35%/℃, then at a high temperature of 75℃, its instantaneous output power will be directly lost by 17.5% (50℃ × 0.35%).
This means a 500W panel can only output 412.5W of power under the scorching sun. This energy efficiency reduction caused by heat is a physical loss that cannot be compensated for through software optimization.
The Pmax coefficient is the core indicator for measuring the heat resistance of modules; the closer the value is to 0, the more stable the power generation performance of the system is in the high temperature range of 45℃ to 85℃.
Cell Materials
The sensitivity of silicon wafers of different technical routes to heat varies greatly; the temperature coefficient of P-type PERC modules is usually between -0.34%/℃ and -0.38%/℃.
In contrast, the temperature coefficient of N-type TOPCon technology has been optimized to between -0.29%/℃ and -0.32%/℃, allowing it to produce 2% to 3.5% more power than traditional P-type modules under the same 70℃ operating conditions.
The best performer is the HJT (heterojunction) cell, with a temperature coefficient of only -0.24%/℃ to -0.26%/℃. In tropical regions or environments with extremely high irradiation intensity, its average annual power generation is about 5% to 8% higher than PERC modules.
· M10 specification N-type cells effectively reduce the resistance heat loss generated by the internal operating current by reducing the carrier recombination rate by 0.5%.
· If a 210 mm large module adopts -0.25%/℃ low-coefficient material, its LCOE can be reduced by more than 0.02 USD in a 25-year cycle.
· Thin-film solar cells (CdTe) have an excellent temperature coefficient of -0.21%/℃, but their market share remains lower than crystalline silicon cells in the face of a 22% comprehensive conversion efficiency.
Voltage Drop
Temperature increase not only weakens output power but also causes the Open Circuit Voltage (Voc) to drop significantly at a rate of -0.25%/℃ to -0.30%/℃.
For a system with a design voltage of 1000 V, if the ambient temperature rises from 25℃ to 65℃, the string voltage will drop by about 100 V to 120 V, which may cause the inverter to deviate from the optimal voltage range (usually 600 V-850 V) for MPPT.
To deal with this voltage fluctuation of more than 10%, engineers must reserve a 15% voltage margin when configuring strings to ensure that the system can still maintain a conversion efficiency level of over 98.2% under extreme 80℃ high temperatures.
The short-circuit current (Isc) increases slightly as the temperature rises, with an increase of about +0.04%/℃ to +0.06%/℃, but this small gain of less than 1% cannot offset the power loss of more than 15% caused by the voltage drop.
Calculating Losses
Taking a 10 kW system located in an area with an average annual temperature of 28℃ as an example, if a cheap module with -0.39%/℃ is chosen, the annual power loss due to temperature rise is about 1460 kWh.
If the module is replaced with a high-efficiency model with -0.29%/℃, about 375 kWh of power output can be recovered annually, earning an extra 75 USD per year at an electricity price of 0.2 USD/kWh.
In a 25-year operating life, the cumulative benefit from a low temperature coefficient will reach 1875 USD, which usually exceeds the procurement price difference of 500 USD to 800 USD between high-quality and low-end modules, with the IRR increasing by 1.2% to 1.8%.
· In ground power plants, increasing the row spacing by 20% can improve natural convection wind speed by 15%, thereby reducing the module temperature by 2℃.
· Choosing light-colored roof materials with an Albedo of 0.2 can reduce the roof ambient temperature by 10℃ compared to dark asphalt shingles with a reflectivity of 0.8.
· For a large 1MW system, for every 0.01%/℃ improvement in the temperature coefficient, about 450,000 kWh more clean energy can be produced in 25 years.
Cooling Tips
The height and inclination of the mounting bracket directly determine the heat dissipation efficiency at a wind speed of about 3 m/s. If the bracket height is lower than five centimeters from the roof, the airflow will decrease by 60%, causing the temperature to rise by 10℃.
The ideal installation gap should be maintained between 10 centimeters and 15 centimeters, which can utilize the chimney effect to reduce the operating temperature by 5℃ to 8℃, equivalent to a disguised increase in real-time power generation of 2.5%.
In addition, modules using a Dual-glass structure have heat dissipation performance improved by 1.2 W/m²·K compared to traditional backsheet structures, effectively alleviating the structural thermal stress of the internal cells.
· In extreme weather above 35℃, using a water-cooling spray system can drop the module temperature from 70℃ to 45℃, and the instantaneous power will recover by more than 8%.
· A single 2 square meter module absorbs as much as 1500W of heat energy under 1,000W/㎡ light intensity, of which only 400W is converted into electrical energy, and the remaining 1,100W is converted into heat.
· Aerodynamically designed frames can increase the contact surface area by 8% and improve heat conduction efficiency by about 3%.
Degradation Rate
Initial Degradation
Solar panels experience Light Induced Degradation (LID) during the first 24 to 48 hours of exposure after installation, which is caused by boron-oxygen complexes in the silicon wafer capturing charges under light.
The first-year degradation rate of traditional P-type PERC modules is usually between 2.0% and 2.5%, which means that after the first month of operation, the actual benchmark for a rated 400W panel may drop to around 390W.
In contrast, N-type TOPCon or HJT modules use phosphorus-doped silicon wafers, eliminating the influence of boron-oxygen complexes at the physical level, and their first-year degradation rate can be controlled within 1.0%, or even as low as 0.8%.
This 1.5% initial power difference means that for a 10 kW residential system, there is an extra 150 W of effective installed capacity output in the first year. Based on an average of 4 hours of effective light per day, the first-year power generation difference is about 219 kWh.
Technology Type | First-year Degradation Rate (%) | First-year Remaining Power (400W Panel) | 24h LID Loss (W) |
P-type PERC | 2.0% - 2.5% | 390.0W - 392.0W | 8.0W - 10.0W |
N-type TOPCon | 1.0% | 396.0W | 4.0W |
N-type HJT | 0.5% - 1.0% | 396.0W - 398.0W | 2.0W - 4.0W |
Annual Degradation
After passing the first-year threshold, the module enters a linear degradation period of 25 to 30 years, and the degradation rate at this stage is determined by the anti-aging performance of the material.
The average annual degradation rate of high-quality N-type modules is only 0.4%, while ordinary P-type modules fluctuate between 0.45% and 0.55%.
Although the 0.1% annual degradation difference seems tiny, the gap will widen exponentially under the 30-year compound interest effect.
By the 30th year of operation, N-type modules can still maintain 87.4% of their initial power output, whereas P-type modules often drop to 83.1% or lower.
This 4.3% power margin at the end of the term means that in the middle and late stages of system degradation, high-quality panels can provide an extra 1.72 kWh of electricity per day (calculated for a 10 kW system), which directly affects the residual value of the asset in the second-hand market or property appraisal.
Calculating Losses
Power degradation is directly linked to LCOE; if a 6 kW system has 2% more cumulative degradation in 25 years, the total power generation will decrease by about 5,400 kWh.
Calculated at a retail electricity price of 0.18 USD/kWh, this is equivalent to a direct economic loss of 972 USD, which exceeds the premium expenditure of 400 USD to 600 USD for purchasing higher-level low-degradation modules.
Considering a 3.5% inflation rate and electricity price rise predictions, the value of electricity 25 years later may reach 0.35 USD, at which time the annual revenue loss due to degradation will soar from 40 USD per year to over 80 USD.
High-efficiency modules can increase the IRR of the system by 0.8% to 1.5% and shorten the investment recovery cycle by 4 to 6 months by lowering the linear degradation slope from -0.5% to -0.35%.
PID Sensitivity
Potential Induced Degradation (PID) is a physical phenomenon caused by leakage current between glass, encapsulation materials, and frames, which can lead to an instantaneous drop of more than 30% in module power.
In IEC 62,804 standard testing, modules are required to run continuously for 96 to 192 hours at 85℃, 85% relative humidity, and a bias voltage of -1000 V to -1500 V.
High-quality modules need to have a power degradation of less than 5% after completing the 192-hour rigorous test, while double-glass modules encapsulated with high-impedance polyolefin (POE) film can usually suppress the PID degradation rate to below 2%.
· Using 2.0 mm tempered glass with 0.5 mm POE encapsulation improves penetration resistance by 10 times compared to traditional EVA encapsulation.
· In coastal areas with humidity exceeding 75%, the PID effect will cause the leakage current of a 1000V system to rise from 0.1 mA to 0.5 mA.
· For every 1% reduction in PID risk, the maintenance cost per kWh decreases by 0.005 USD over the 25-year life.
Warranty Table
Mainstream Tier 1 manufacturers in the market provide two independent warranty schemes: a 12 to 15-year "Product Workmanship Warranty" and a 25 to 30-year "Power Output Warranty".
The power warranty promises that the output power after 25 years will not be less than 84.8% of the rated value. For some top HJT modules, this standard has been raised to no less than 88% after 30 years.
If, in the 15th year of operation, the actual power of the module measured by professional testing instruments such as Fluke is lower than 92% of the promised curve, the user has the right to demand proportional compensation or replacement from the manufacturer.
This long-term financial guarantee is supported by DH2000 (Damp Heat 2000 h) and TC600 (Thermal Cycle 600 times) test data, ensuring that the deformation of encapsulation materials remains within 0.5 mm under severe temperature changes from -40℃ to 85℃, without producing cell micro-cracks that cause power degradation.
Year of Operation | N-type Expected Output(%) | P-type Expected Output(%) | Performance Gap(%) |
Year 1 | 99.0% | 98.0% | +1.0% |
Year 10 | 95.4% | 93.5% | +1.9% |
Year 25 | 89.4% | 84.8% | +4.6% |
Year 30 | 87.4% | 83.1% | +4.3% |
Material Selection
The weighting of encapsulation material selection on the degradation rate accounts for as much as 40%. Modules using EPDM sealing strips have a water vapor barrier rate at the frame 15% higher than ordinary silica gel.
If the backsheet uses PVF film instead of cheap PET material, its anti-ultraviolet yellowing lifespan can be extended from 15 years to 30 years, reducing insulation performance decline and power drops of more than 3% caused by backsheet cracking.
· The number of busbars increased from 5BB to 16BB (SMBB technology), shortening the current transmission path by 50% and effectively alleviating the extra 0.2% annual degradation caused by micro-cracks.
· If the heat dissipation efficiency of Schottky diodes inside the junction box is improved by 10℃, it can reduce more than 500 abnormal hot spot cycles, preventing a 10% power drop of local cells due to high-temperature aging.
· The light transmittance decline of high-transmittance glass (fully tempered patterned glass) should be controlled within 0.8% after 30 years to ensure light energy capture efficiency does not shrink significantly over time.