What Are the Facing Solar Power Today | 3 Challenges
In 2026, the solar industry is facing three core challenges: a photovoltaic (PV) conversion efficiency bottleneck of around 20%, grid peak-shaving and energy storage gaps caused by intermittent power generation, and project cost uncertainties of over 30% triggered by geopolitical trade policy fluctuations.
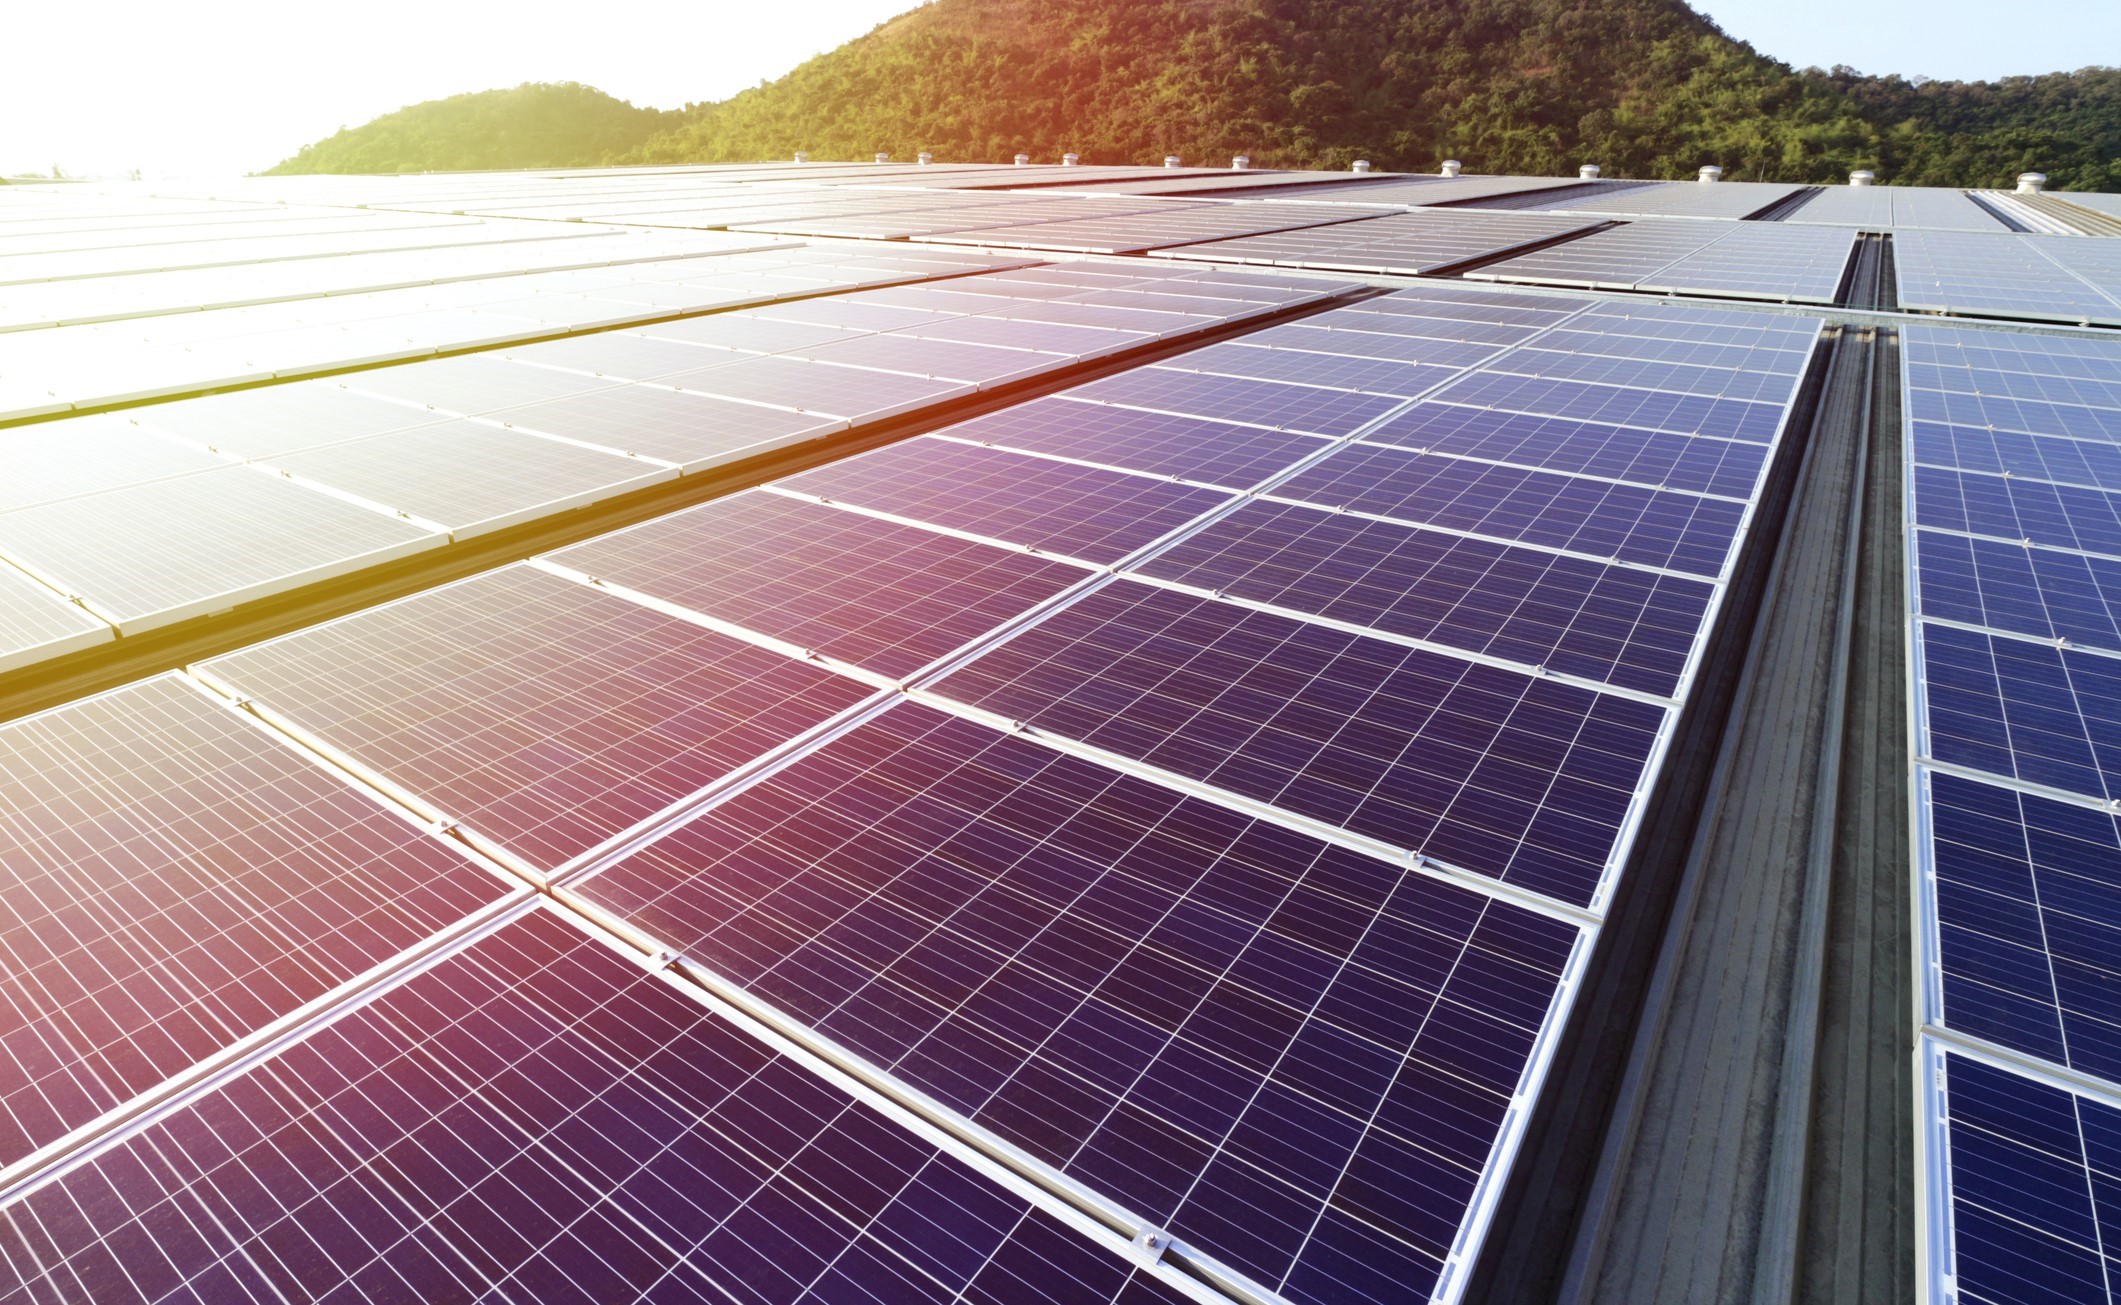
Intermittency and Energy Storage Solutions
Waiting for the Sun to Set
Every day, solar radiation intensity reaches its peak between 10:00 AM and 3:00 PM, with the instantaneous power output of PV systems accounting for 85% to 95% of their rated capacity.
However, peak household electricity demand typically occurs between 6:00 PM and 10:00 PM. During this time, as the solar elevation angle decreases, PV output drops by 5 MW to 10 MW per minute, resulting in a severe supply-demand mismatch of approximately 5 hours.
· The "Duck Curve" in California shows that in regions where PV grid integration reaches 30%, the net load at 12:00 PM drops to extremely low levels, while around 6:00 PM, the grid needs to dispatch an additional 15,000 MW of power within 180 minutes to fill the gap.
· This drastic demand for power ramping forces traditional gas turbines to increase load at a rate of 50 MW per minute, causing mechanical wear-and-tear costs to rise by 15% to 20%.
· Without supporting energy storage, more than 20% of solar generation is wasted at noon because the grid cannot absorb it. This abandoned "curtailment" loss directly reduces the annual yield of the entire power station by 5%.
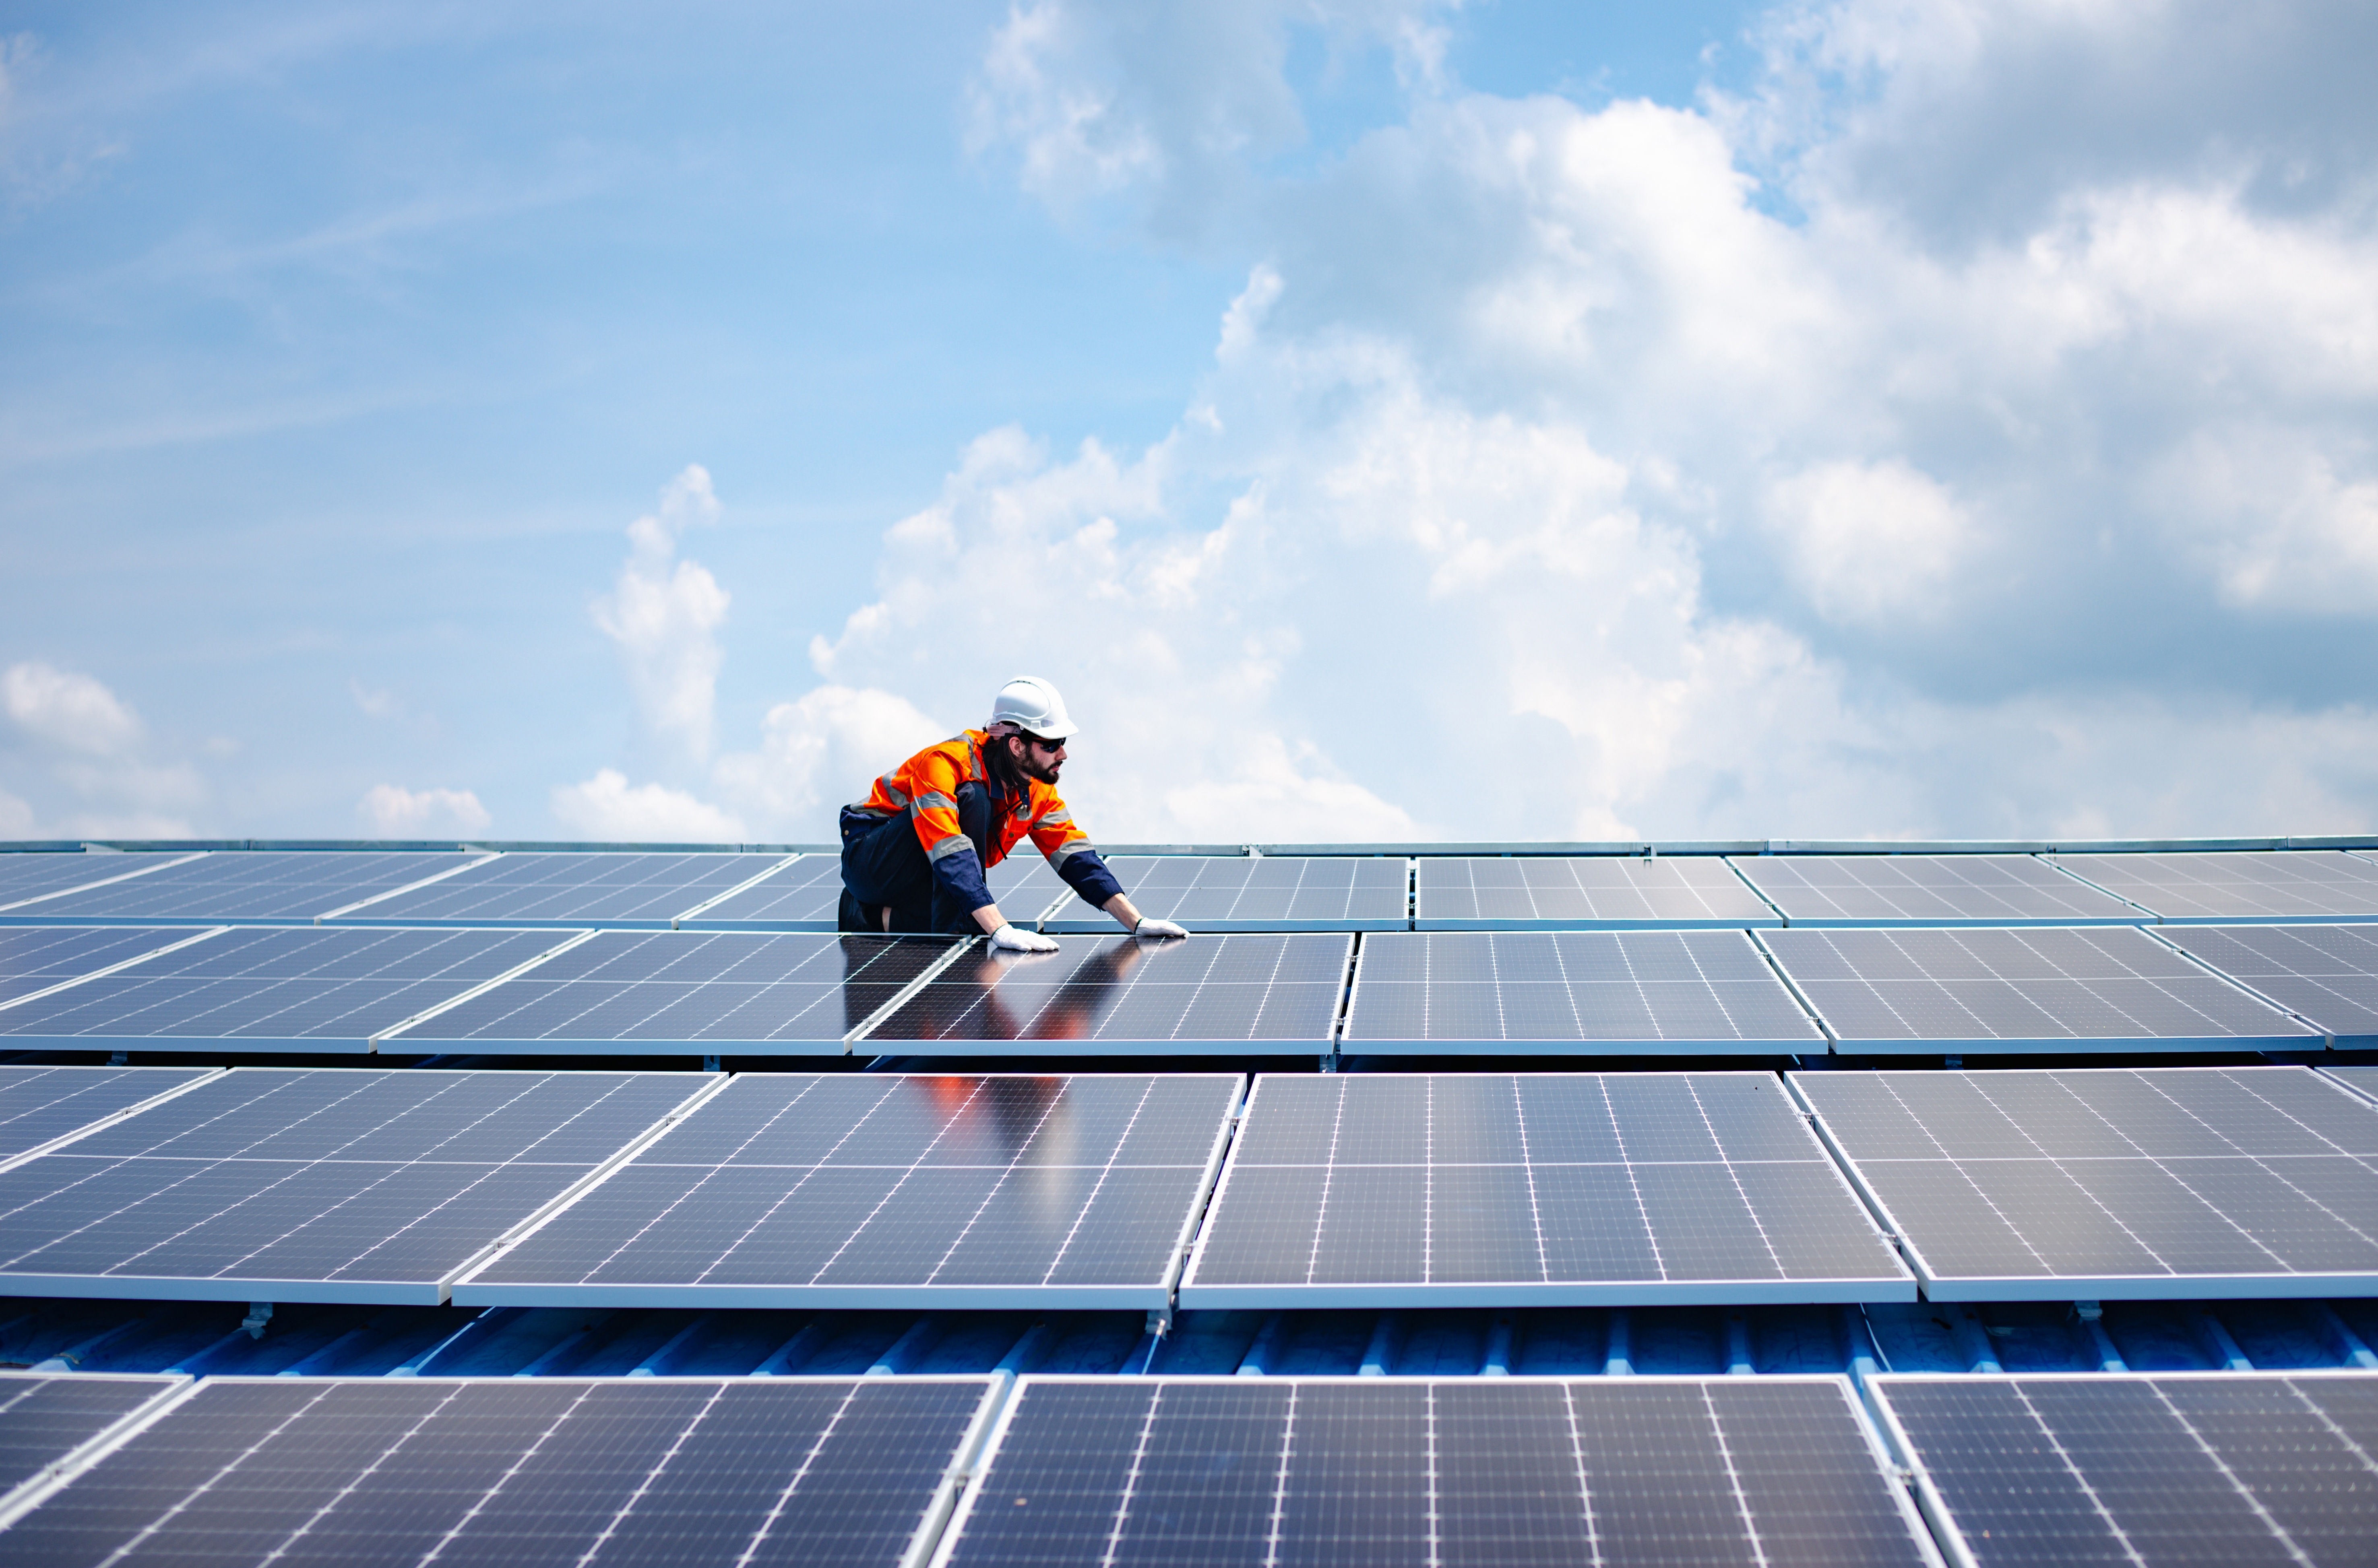
Why Are Batteries So Expensive?
For a 100 MW PV power plant, configuring a 2-hour (200 MWh) energy storage system requires an additional initial investment budget of $50 million to $70 million. This extends the overall investment recovery period of the solar plant from 6 years to over 9 years.
· The energy density of Lithium Iron Phosphate (LFP) cells is approximately 160Wh/kg to 180Wh/kg. A complete storage container includes not only batteries but also thermal management systems, Cell Management Systems (BMS), and Power Conversion Systems (PCS), which account for 30% to 40% of the total cost.
· Batteries experience a 10% to 15% Round-Trip Efficiency (RTE) loss during charging and discharging. For every 100 kWh stored, only 85 to 90 kWh are retrieved. This electricity premium of 5 to 10 cents must be covered by the price difference in electricity rates.
· The price of lithium carbonate once skyrocketed from $15,000 to $90,000 per ton within a single year. Such 500% price volatility forced many storage projects under construction to halt for 3 to 6 months due to budget overruns.
Wasted Electricity
During high-noon periods when solar power is extremely abundant, the grid frequency may exceed the rated upper limit of 50.2 Hz due to supply exceeding demand.
To maintain grid stability, dispatch centers order PV inverters to operate at reduced power. This power-limiting operation forces inverters to drop below their 98.5% efficiency potential, resulting in an annual loss of 300 to 500 hours of full-power generation.
· While pumped hydro storage can reduce the per-unit cost of electricity to below $0.05, site selection is extremely dependent on terrain, construction cycles usually last 6 to 10 years, and energy conversion losses remain around 25%.
· Hydrogen energy storage schemes are currently extremely inefficient. From electrolysis for hydrogen production to compression storage and then back to fuel cell power generation, the total energy cycle efficiency is only 35% to 40%. More than 60% of the solar current is turned into useless heat during conversion.
· Existing Compressed Air Energy Storage (CAES) systems have a lifespan of up to 30 years but are completely unsuitable for small to medium-sized distributed PV (such as 50 kW rooftop projects) because their system footprint typically requires tens of thousands of square meters.
How Many Years Can It Last?
General LFP batteries, under a 1C charge/discharge rate (full charge/discharge in 1 hour), will see their capacity decay to 80% of the initial state after 3,000 to 6,000 cycles.
If a deep charge and discharge is performed once a day, the cell system will require large-scale module replacement after 8 to 10 years.
· For every 10-degree Celsius increase in operating temperature, the internal electrochemical reaction speed of a lithium cell accelerates, leading to a lifespan reduction of over 15%. To maintain batteries in the optimal 25°C range, the power consumption of liquid cooling systems takes up 3% to 5% of the total storage system power.
· Cell self-discharge is also a loss factor; about 1.5% to 3% of the electricity disappears every month due to internal chemical activity. If a storage system is idle for two weeks, the lost electricity is enough to offset 2% of the net income generated by the PV modules that day.
· The disposal cost of retired batteries is currently between $500 and $800 per ton. Although metals like lithium, cobalt, and nickel can be recovered, the current recycling profit margin is only about 10%. Many projects did not include these dismantling costs 20 years down the line in their initial budget planning.
Infrastructure and Grid Integration
Aging Lines
Currently, about 40% of the world's transmission lines have been in service for more than 30 years. Their original design was for unidirectional coal-fired power transmission and cannot handle the bidirectional current fluctuations generated by PV.
When the penetration of residential rooftop PV reaches 15% of the rated capacity of the distribution transformer, the low-voltage side voltage will rise by 3% to 5%, causing the internal winding temperature of the transformer to rise by an average of 8°C.
This overheating phenomenon will shorten the lifespan of a transformer originally intended for 30 years to about 22 years, increasing annual maintenance expenditures by more than $500.
Transformer expansion costs $15,000.
Legacy grid voltage fluctuations often exceed standards by 10%.
Distribution network renovation costs reach $80,000 per kilometer.
30% of old equipment cannot withstand reverse power flow.
To integrate these scattered solar currents into the old system, grid companies must install expensive On-Load Tap Changers (OLTC), with a single unit costing between $50,000 and $120,000.
In communities with dense PV integration, due to the increased dispersion of voltage frequency, the harmonic distortion rate recorded by power quality monitors often stays around 4%, approaching the 5% safety threshold.
To absorb this excess reactive power, the grid needs to configure additional capacitor banks, with an investment budget of approximately $25,000 per Megavar (Mvar).
Too Far Away
Large-scale ground-mounted power stations are usually built in desert areas with more than 3,000 annual sunshine hours, while consumption centers are often more than 1,500 kilometers away.
The construction of a 500 kV high-voltage AC transmission line costs approximately $1.2 million to $2 million per kilometer, and transmission losses increase with distance, with a power loss rate of 6% to 8% per 1,000 kilometers.
For every 100 MW generated by a power station, only 92 MW reaches the city, directly resulting in an annual revenue loss of about $4 million for the station.
Long-distance transmission needs to cross five administrative regions.
Line construction cycles usually last five years.
UHVDC converter stations cost up to $1 billion.
Land acquisition compensation accounts for 15% of the total budget.
To reduce losses, ±800 kV Ultra-High Voltage Direct Current (UHVDC) technology must be used. While the transmission capacity of such lines can reach 10GW, the supporting converter stations occupy more than 300 acres.
During the project approval stage, the passage rate for environmental impact assessments and land use applications for cross-regional transmission lines is only 45%, with an average delay of 24 to 48 months.
For every year of delay in grid connection, the financial loss to the project owner due to loan interest and missed electricity subsidies accounts for about 3% of the total investment.
Mismatching Rhythms
PV power generation relies on inverters, which lack the massive mechanical rotational inertia of traditional steam turbines. This makes the grid very fragile in the face of sudden failures.
When cloud cover causes PV output to drop by 70% within 30 seconds, the grid frequency will deviate from the 50 Hz or 60 Hz standard at a rate of 0.2 Hz per second.
If the frequency deviation exceeds 0.5 Hz, grid protection devices will automatically disconnect, leading to instantaneous power outages for 50,000 to 100,000 households.
Inverter response time is less than 100 milliseconds.
Lack of rotational inertia leads to frequency instability.
Frequency modulation reserve capacity must account for 10% of the total load.
Fast frequency response systems cost $30,000 per Megawatt.
To compensate for this lack of dynamic stability, the grid must force PV power plants to configure at least 20% capacity in fast frequency modulation devices.
Each time these devices operate, the depreciation cost of their internal power semiconductor modules is approximately $5.
Currently, in some small grids where the solar ratio exceeds 40%, more than 15 frequency regulation operations are required daily to maintain stability, increasing grid operation and dispatch costs by 12% to 18%.
Slow Procedures
In many countries, the waiting list for PV projects to apply for grid connection has accumulated a capacity of over 2,000 GW, which is nearly 1.2 times the current global installed capacity.
For a typical 50 MW PV project, the average waiting time from application submission to obtaining a grid connection permit has increased from 18 months in 2015 to 60 months today.
During the waiting period, developers must pay approximately $100,000 annually in land retention and project maintenance fees.
Only 20% of projects in the queue are eventually built.
Grid connection study fees are as high as $250,000.
Grid upgrade assessments account for 10% of total costs.
The approval process involves 12 different government departments.
Due to limited grid capacity, new projects are often required to bear a portion of the public grid upgrade costs.
This "apportionment" amount sometimes accounts for more than 15% of the total project investment.
If a developer refuses to pay this reinforcement fee, which averages as high as $5 million, the project is shelved indefinitely.
Data shows that approximately 40% of projects are forced to cancel during the queuing stage because they cannot afford these unplanned grid upgrade expenses, resulting in the total loss of the initial $300,000 feasibility study budget.
Software Lag
A city with 100,000 rooftop PV points generates 5 GB of data per second, while the processing limit of older SCADA systems is only 1 GB per second.
Delays in data processing result in a 5-to-10-second deviation in dispatch commands, which is enough to trigger serious oscillation accidents in voltage regulation.
Smart grid software upgrades require an investment of $200 million.
Smart meter coverage is currently only 65%.
Communication network bandwidth needs to be increased by more than 10 times.
Cybersecurity maintenance fees account for 5% of operating costs.
To solve this problem, grids need to deploy AI-based forecasting software to improve the accuracy of weather forecasts to a 15-minute level.
The annual licensing fee for such professional software is usually between $500,000 and $2 million.
Meanwhile, to prevent hacker attacks, the communication module of every connection point requires hardware encryption.
The upgrade cost for a single point is $300, which, for large utility companies, represents a massive long-term budget involving tens of millions of dollars.
Supply Chain and Material Sustainability
Expensive Raw Materials
In the cost structure of PV modules, raw materials account for more than 70% of total expenditures.
The thickness of monocrystalline silicon wafers has been reduced from 180 microns to between 130 and 150 microns. While this thinning process reduces silicon usage, it increases the breakage rate during manufacturing, which currently averages between 3% and 5%.
The price of polysilicon has experienced violent fluctuations over the past three years, rising from a low of $10 per kg to over $40. This 400% increase directly led to a rise in module costs by $0.05 to $0.08 per watt.
Silver paste is the most expensive non-silicon material in the cell. The silver consumption of a single HJT (Heterojunction) cell is about 150 mg to 200 mg, compared to about 80 mg for traditional PERC cells.
Although the industry is promoting "silver-free" technologies, such as copper plating, the current mass production yield is only around 90%, making it unable to fully replace silver.
The global PV industry's annual demand for silver accounts for 10% to 15% of total supply. For every $100 increase in the price of silver, the per-watt cost of modules fluctuates by about 1% to 2%.
Material Name | Weight % | Cost % | Main Function |
Tempered Glass | 65% - 70% | 10% - 15% | Protection and Light Transmission |
Aluminum Frame | 10% - 15% | 15% - 20% | Structural Support and Installation |
Solar Cells | 3% - 5% | 50% - 60% | Core Conversion Hub |
EVA/POE Film | 3% - 5% | 5% - 8% | Encapsulation and Moisture Proofing |
Backsheet/Silver/Ribbon | 2% - 5% | 5% - 10% | Circuit Connection and Insulation |
High Freight Costs
Solar panels are large-sized, heavy goods. Logistics costs account for 8% to 15% of the total Cost, Insurance, and Freight (CIF) price in international trade.
A standard PV module is approximately 2.3 square meters and weighs between 28 kg and 32 kg.
A 40-foot high-cube container can typically hold 20 pallets, totaling about 620 to 720 modules, with a total power of approximately 350 kW to 450 kW.
When international ocean freight rates soar from $2,000 to $10,000 per container, the freight premium per watt reaches over $0.02, which almost negates the production profit at the factory end.
To prevent micro-cracks during the 30-to-45-day sea voyage, pallets must use fumigated solid wood or high-strength composite boards, costing $20 to $35 per pallet.
If improper port handling leads to a damage rate exceeding 0.5%, the insurance claim cycle usually takes 90 to 180 days, which severely ties up the installer's liquidity.
Currently, carbon emissions from the logistics sector account for about 10% of the life-cycle carbon footprint of PV systems. Shortening the supply chain radius has become a solution for cost reduction.
Mineral Shortage
In Cadmium Telluride (CdTe) thin-film batteries, the abundance of tellurium is comparable to that of platinum. 80% of the world's tellurium is a byproduct of copper mining, and its supply is entirely limited by the speed of copper extraction.
If global solar installations are to reach the target of 1TW per year, the consumption of tellurium will exceed current mining capacity by more than three times.
Indium, a key module of Transparent Conductive Oxide (ITO) films, experiences frequent price fluctuations, hovering between $200 and $500 per kg.
Currently, about 70% of indium is used in the flat-panel display industry; the PV industry must compete for these limited resources.
Mining these minerals usually requires a development cycle of 10 to 15 years, while the demand growth rate for PV is over 20% per year. This time gap between supply and demand causes the raw material market to face shortages every 2 to 3 years.
Rare Metal Name | Solar Application | Global Annual Production (Est.) | Resource Concentration |
Indium | HJT / Thin-film | 900 Tons | High (Specific mines) |
Gallium | GaAs / Multi-Si additives | 500 Tons | Extremely High (Refining costs) |
Tellurium | CdTe Thin-film | 600 Tons | Medium (Copper byproduct) |
Germanium | Space / High-efficiency cells | 140 Tons | High (Coal byproduct) |
Decommissioned Panels
PV modules are designed for a 25-year lifespan. The first batch of power stations installed in the early 2000s is now entering the decommissioning phase.
By 2030, global waste PV modules are expected to reach a cumulative 1 million tons, and by 2050, this figure will soar to 78 million tons.
Currently, the cost of recycling a standard module is about $12 to $25, while the cost of direct landfilling is only $1 to $5.
This price difference results in less than 10% of decommissioned panels entering formal recycling channels globally.
To separate glass, cells, and backsheets, mechanical crushing, thermal treatment, and chemical cleaning are required.
While over 95% of aluminum and glass can be recovered, the most valuable silver and silicon are difficult to extract to a 99.9999% purity standard for reuse due to contamination with other chemicals.
Currently, the cost of recycled silicon is 20% to 30% more expensive than buying new silicon, leaving recycling companies with little commercial incentive.
If handled improperly, the fluorine in the backsheet and the lead in the cells can take over 200 years to degrade in soil, posing long-term potential risks to groundwater.
Carbon Footprint
Producing one kilogram of polysilicon requires 50 to 80 kWh of electricity.
Based on Energy Payback Time (EPBT) calculations, a PV system needs to run for 1.2 to 2.5 years to offset the energy consumed during its production, transport, and installation.
In regions where fossil fuels dominate the energy mix, the CO2 emissions per watt of PV panel production are about 400 to 500 grams.
Reducing the carbon intensity of the production side is becoming a new trade entry barrier.
Some markets already require imported modules to provide Environmental Product Declaration (EPD) certificates, detailing carbon emission data from the mine to the factory.
To comply, factories need to invest an additional $5 million to $10 million in digital energy-efficiency upgrades.
If carbon footprint data exceeds limits, modules may face carbon tariffs of $0.01 to $0.03 per watt, which is a massive cost pressure for a manufacturing sector with profit margins of only around 5%.