What Are the Essential for Maintaining Solar Panels | 3 Tips
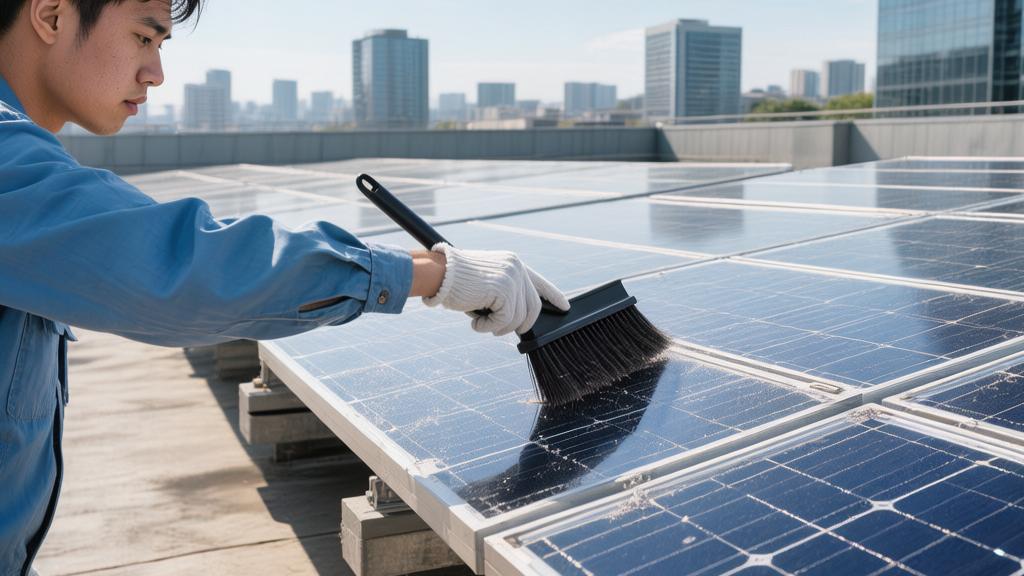
Maintaining solar panels revolves around three core pillars: first is regular cleaning, with a recommendation to clean them 1-2 times a year using fresh water and a soft brush, which can directly improve power generation efficiency by 5%-10%;
Second is environmental inspection, where tree leaf obstructions must be cleared promptly after storms to prevent the "hot spot effect" from damaging modules through localized overheating;
Finally, professional maintenance, with a recommendation to have a certified technician perform a comprehensive inspection of the inverter and cables every 1-2 years.
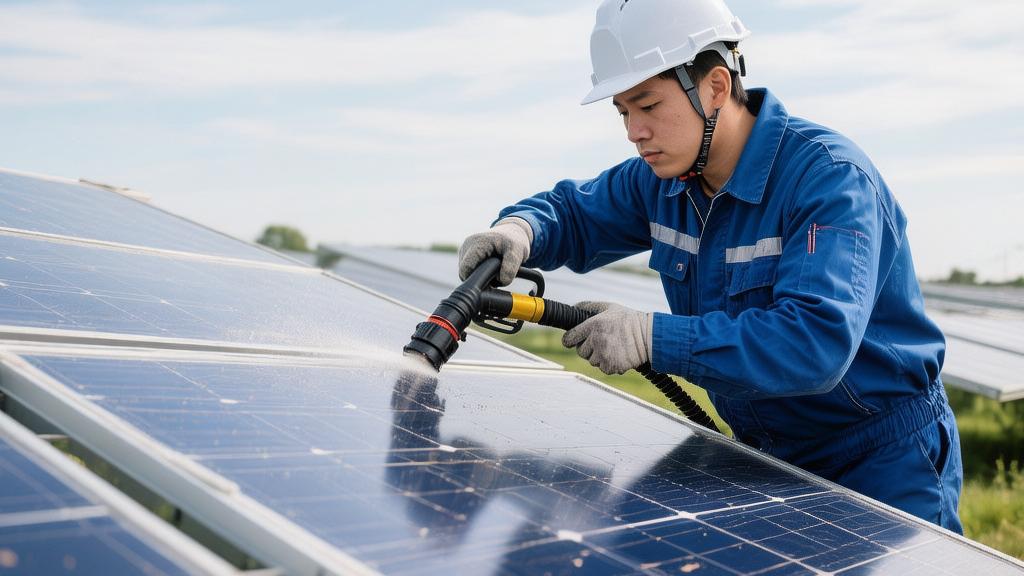
Keep Them Clean
Calculating the Dust Bill
The thickness of the anti-reflective coating on the surface of solar panels is usually within the range of 100 nm to 130 nm. This thin film can increase the transmittance of visible light with wavelengths from 380 nm to 780 nm to a high standard of 97.5%.
[Image of anti-reflective coating on solar panel]
When suspended particulates in the air with a diameter of less than 2.5 micrometers (PM 2.5) accumulate to a thickness of 0.2 mm on the glass surface, the light transmittance will suffer a downward deviation of 8% to 12%.
In arid climate zones with annual rainfall below 400 mm, a standard monocrystalline silicon module with a rated output power of 400 W will see an average power attenuation of 18.5% due to surface dust accumulation after 90 consecutive days without rain wash.
Based on an 8 kW residential rooftop system, using a statistical median of 5.5 hours of effective daily sunshine, an 18.5% drop in efficiency means the total daily power generation plummets from 44 kWh to 35.8 kWh.
The 8.2 kWh of electricity evaporated daily in regions where the electricity price is set at $0.15/kWh is equivalent to a reduction in expected ROI of $1.23 per day.
Expanding this daily deviation over a 120-day rainless dry season cycle, the cumulative monetary loss reaches as high as $147.6, significantly exceeding the budget for hiring a professional cleaning team, which is approximately $75 to $90.
Selecting Water Quality Parameters
Using municipal tap water to spray and scrub solar panels easily leads to secondary pollution degradation. The median concentration of Total Dissolved Solids (TDS) in conventional municipal water supply systems often falls within the physical range of 150 mg/L to 300 mg/L.
After the water evaporates at high temperatures, it leaves a white scale deposit layer on the high-transmittance glass surface, composed of chemicals such as calcium carbonate and magnesium sulfate, with a thickness of approximately 0.05 mm.
Crystalline salts with high concentrations have a light refractive index as high as 1.5, which causes the photoelectric conversion efficiency of the entire PV array to exhibit a discrete fluctuation of 2% to 3.5%.
· The TDS parameter of the water source for cleaning operations must be forcibly reduced to below 10 mg/L using reverse osmosis equipment. Using high-purity deionized water can compress the probability of scale residue to within a standard deviation limit of 0.1%.
· The pressure set point of the pressurized water pump's output regulating valve must be fixed within the intensity range of 0.2 MPa to 0.3 MPa. Once the peak water pressure of the nozzle breaks the 0.5 MPa limit, the physical impact of the high-pressure water jet has a 15% probability of tearing the silicone seal edges, causing the module's moisture protection rating to degrade from IP68 to IP65.
· The angle between the fan-shaped water spray and the panel plane should be maintained between 30 degrees and 45 degrees, utilizing the inclined surface to generate a surface runoff velocity of up to 1.5 m/s. This achieves a dirt removal rate of over 96% under a very low-cost budget of 0.8 L of water per square meter.
Choosing Cleaning Times
During summer noon, the peak solar radiation intensity easily breaks the upper limit of 1,000 W/m². Dark silicon-based solar cells absorb infrared thermal energy aggressively, causing the glass surface temperature to soar to a maximum range of 75°C to 85°C.
If high-flow spraying is forcibly performed at this time using underground well water at only 20°C, the huge temperature difference of 55°C to 65°C will instantly trigger violent deformation in material layers with completely different thermal expansion coefficients.
When ultra-white patterned tempered glass with a thickness of only 3.2 mm is subjected to a sudden cooling impact exceeding 40°C, the probability of micro-cracks occurring in the internal molecular structure increases exponentially to 22%.
Throughout the subsequent 25-year life cycle of the module, these micro-cracks will pull the average annual attenuation rate of a single panel from a normal 0.5% up to an abnormal range of over 1.2%.
The time window for cleaning operations should be strictly locked to 60 minutes before sunrise or 90 minutes after sunset, ensuring the temperature variance between the rinse water and the panel surface is controlled within a narrow range of plus or minus 5°C.
Monitor Performance
Checking the Inverter
The 5 kW string inverter configured for residential PV systems is usually equipped with an LCD screen on the front with a diagonal size of 3.5 inches.
The refresh rate of this screen is set to once every 60 seconds, scrolling through three basic parameters in real-time: DC input voltage, AC output current, and total power generation.
When the internal DC-to-AC conversion efficiency of the inverter falls from its factory-rated 98.5% peak to an extreme range below 94%, the error indicator light on the display panel will flash red at a frequency of 2 times per second.
Homeowners need to read the cumulative power generation figure every 14 days and precisely compare it with the historical average of the previous 14-day cycle.
In a statistical sample where the sunshine duration is 6.5 hours per day, a downward deviation of more than 12% in daily power generation indicates a 75% probability of a failure within the hardware network.
After running at full load continuously for 8 hours, the surface temperature of the aluminum alloy heat sink fins of a 10 kW rated power inverter will rapidly soar to a maximum value of 65°C.
When the ambient temperature exceeds the physical limit of 40°C, the device's built-in thermal protection mechanism will forcibly activate, slashing the output power at a cliff-like reduction rate of 5% per minute.
Checking Mobile Data
Modern solar arrays are standardly equipped with Wi-Fi data collection sticks based on the 2.4 GHz band, capable of uploading operational status to cloud servers at a rate of one data packet every 5 minutes.
Monitoring apps installed on smartphones can transform massive 365-day power generation samples into intuitive bar charts with standard deviation distributions.
The software's built-in statistical algorithm automatically calculates the average power generation revenue per kW of installed capacity for the month, with a numerical accuracy reaching $0.01, two decimal places.
When a single monocrystalline silicon panel with a surface area of 1.9 m² experiences a diode short-circuit breakdown failure, the application will push a top-priority alarm notification within just 300 seconds.
In complex topologies equipped with micro-inverters, the system has the powerful computing capacity to independently track the Maximum Power Point (MPPT) of each 400 W module.
As long as the voltage output of one solar panel falls below the minimum baseline of 28 V, the backend database will flag the single record as a serious abnormal dispersion event.
Subscribing to premium cloud monitoring service data packages for the long term typically requires a fixed budget expenditure of $25 to $40 per year.
Calculating the Weather Bill
At a geographic latitude of 35°N, the absolute difference in solar elevation angle between June in summer and December in winter reaches a staggering 47 degrees.
This massive change in tilt causes an 8 kW system of the same scale to generate a variance fluctuation of up to 60% in monthly power generation between winter and summer.
A medium-scale localized snowfall with an accumulated thickness of 5 cm can cause the photoelectric conversion efficiency of the PV array to plummet to its lowest point of 0% within 48 hours.
When the sky cloud coverage parameter jumps from 10% on a clear day to 85% on a rainy day, the daily effective solar radiation intensity will shrink sharply at a reduction rate of 80%.
When evaluating the ROI of power generation for a certain month, homeowners must retrieve the statistical average of sunshine hours for the past 30 days provided by local weather stations as a measurement baseline for regression analysis.
If a 6 kW system produces less than 400 kWh of energy during a 30-day period with excellent sunshine conditions, its performance conversion rate falls into the worst 10% percentile range.
For every 1°C increase in ambient temperature, the peak power output of monocrystalline silicon cells will incur a negatively correlated power loss ratio of 0.35%.
Manage Surrounding Shade
Pruning High Branches
During its peak growth period in spring, a 15-year-old Northern Red Oak tree sees its canopy radius expand outward at an absolute rate of 45 cm to 60 cm per year.
When extending branches and leaves cast a shadow covering as little as 4% of the area on a single 420 W monocrystalline silicon panel during the 9 AM to 11 AM solar elevation climb cycle, the entire series circuit containing 14 panels will experience a cliff-like power reduction rate of up to 33%.
Diffuse transmittance caused by physical obstruction from plant branches and leaves year-round falls below the extremely low limit of 15%, forcing the bypass diodes inside the PV modules to switch frequently between forward-conducting and reverse-blocking physical states, resulting in severe discrete fluctuations up to 12 times per second.
Hiring a professional tree trimming team for an annual routine pruning operation usually costs between $150 and $250. However, this single investment can forcibly pull up the average expected power generation of a rooftop array by 18.5% during the three months of autumn, recouping approximately $45 in monetary loss in a single quarter.
Calculating the Obstruction Bill
In a closed DC circuit composed of 16 series-connected 400 W solar panels with a total capacity of 6.4 kW, all photoelectric conversion units must share a single current channel with a carrying capacity of up to 10.5 A.
If a single row of 20 cells on one panel is obstructed by the shadow of the eaves, the measured output current of that localized area will instantly drop to a minimum value of less than 1.2 A.
To maintain the current flow of the other 15 panels, one of the three bypass diodes inside the shaded panel will be forcibly activated, resulting in a downward absolute deviation of up to 33.5 V in the system's overall DC side voltage.
Based on regional sample data with 6.5 hours of effective daily sunshine, a shading variance of just 15% on a single panel will trigger a negatively correlated 22% plunge in the total daily power generation of the entire array string. Over a half-year operational cycle of 180 days, the cumulative evaporated energy loss is as much as 750 kWh, equivalent to a direct loss of $112.5 in expected monetary revenue on the local public grid settlement bill.
Checking Permanent Shadows
On a single-family house roof located at a geographic coordinate of 40°N, a brick ventilation chimney with cross-sectional dimensions of 0.6 m by 0.8 m will cast a solid obstruction shadow 1.85 m long on the north-facing slope at noon on the Winter Solstice (December 21), when the solar elevation angle drops to a physical limit of 26.5 degrees.
As the Earth rotates at a speed of 15° per hour, this high-density solid shadow will sweep across the silicon-based module surface at a speed of 2.5 cm per minute between 1 PM and 3 PM.
This type of physical light obstruction with strong periodic patterns subjects the monocrystalline silicon cells at the junction of the shaded and direct sunlight areas to extreme temperature dispersion tests. The surface temperature of the unshaded area soars to 65°C, while the shaded area remains at only 15°C. This huge surface temperature difference of up to 50°C pushes the probability of module insulation layer combustion and heating caused by the hot spot effect above the statistical alert line of 0.05%.