Why are Solar Cells Needed?
With solar power costs dropping over 85% in the past decade, they are now a crucial, affordable energy source for enhancing grid reliability and achieving energy independence, from powering homes to electric vehicles.
Growing Energy Demand
Over the past 30 years, global population has surged from 5.3 billion to 8 billion—a 51% jump—while GDP per capita in emerging markets rose 180%, directly fueling energy appetite. The International Energy Agency (IEA) reports that between 2010 and 2022, global primary energy consumption grew 25%, but electricity demand outpaced it at 2.5% annual growth, double the rate of total energy use.
First, industrialization in Asia's emerging economies. China's industrial sector, which consumes 65% of the nation's total energy, saw manufacturing output grow 8% yearly from 2015–2022, pushing industrial electricity use up 4.2% annually. India's steel production, now 7% of global output, requires 550 kWh per ton—enough to power 50 homes for a day—and its cement industry adds another 300 TWh to annual demand. Second, urbanization. By 2023, 56% of the world lived in cities, up from 47% in 2010; urban households in Brazil now use 1,800 kWh/year, 40% more than rural ones, due to air conditioners and appliances. A 2022 study found that city dwellers in hot climates install AC units 3x faster than those in temperate zones, adding 20% to summer peak loads in cities like Jakarta and Lagos.
Third, electrification of transport and tech. EVs added 55 TWh to global electricity demand in 2023, equivalent to powering 5 million homes. Data centers, critical for cloud services, consumed 200 TWh in 2022—up 15% from 2020—with cooling systems accounting for 40% of that. The IEA's 2023 outlook puts it bluntly:
"By 2030, global electricity demand will reach 38,000 TWh, a 35% increase from 2022. Two-thirds of this growth comes from EVs, data centers, and heat pumps in buildings."
Even household habits shift demand: global air conditioner ownership jumped from 1.2 billion in 2010 to 2.2 billion in 2023, with each unit adding 1,500 W to peak load during heatwaves. In the U.S., residential AC now uses 6% of total electricity, up from 4% in 2000.
Cleaner Than Fossil Fuels
Fossil fuels—coal, gas, oil—still power 82% of global energy, but their environmental cost is measured in staggering numbers. In 2022, energy-related CO₂ emissions hit 36.8 billion tons, with coal alone responsible for 15 billion tons (41%). Beyond carbon, they spew pollutants that harm health and ecosystems: sulfur dioxide (SO₂) from coal causes acid rain, nitrogen oxides (NOₓ) form smog, and fine particulate matter (PM₂.5) leads to respiratory diseases. The World Health Organization links air pollution to 7 million premature deaths yearly, 25% tied to fossil fuel combustion.
Metric | Coal Power | Natural Gas | Oil Power | Solar Cells (Lifecycle) |
CO₂ Emissions (g/kWh) | 820 | 490 | 720 | 40 |
SO₂ Emissions (g/kWh) | 2.2 | 0.1 | 1.8 | 0.01 |
NOₓ Emissions (g/kWh) | 1.5 | 0.9 | 1.2 | 0.02 |
PM₂.5 Emissions (μg/m³) | 1.2 | 0.1 | 0.9 | 0.005 |
Water Use (L/MWh) | 2,500 | 1,500 | 2,000 | 0 (dry cooling) |
Land Disturbance (m²/MW/yr) | 10 | 5 | 8 | 2 (rooftop/agrivoltaics) |
A typical coal plant emits 820 grams of CO₂ per kilowatt-hour (kWh), while solar generates just 40g/kWh over its 25-year life—a 95% reduction. For context, a 10 MW solar farm avoids 12,000 tons of CO₂ yearly, equal to taking 2,600 cars off the road. Gas is cleaner than coal (490g/kWh) but still 12x dirtier than solar. SO₂, a key cause of acid rain, drops from 2.2g/kWh (coal) to 0.01g/kWh (solar)—a 99.5% cut. In 2021, U.S. coal plants emitted 1.1 million tons of SO₂; replacing 10% with solar would slash that by 110,000 tons.
Pollutants like NOₓ and PM₂.5 follow the same pattern. Coal's 1.5g/kWh NOₓ becomes 0.02g/kWh with solar, reducing smog-forming compounds by 98.7%. PM₂.5, linked to asthma and heart disease, falls from 1.2μg/m³ (coal) to 0.005μg/m³ (solar). A 2023 study in Delhi found coal power contributes 30% of urban PM₂.5; switching to solar could lower that by 28%, cutting hospital visits for respiratory issues by 15%.
Lower Long-Term Costs
The International Renewable Energy Agency (IRENA) notes solar's levelized cost of electricity (LCOE)—total lifetime cost divided by energy produced—dropped 89% since 2010, from 0.37/kWhto0.04/kWh in 2023. Compare that to coal's LCOE, which rose 30% in the same period to $0.13/kWh due to pricier coal and stricter pollution rules. For homeowners and utilities, this math means solar often pays back its cost in 6–10 years, then generates free power for 15–20 years.
Metric | Solar Cells (Utility-Scale) | Coal Power Plant | Natural Gas Peaker |
Initial Investment ($/kW) | 800–1,200 | 1,500–2,500 | 1,000–1,800 |
Fuel Cost (% of OPEX) | 0% | 60% | 70% |
O&M Cost ($/kW/year) | 15 | 45 | 30 |
LCOE ($/kWh, 2023) | 0.04–0.06 | 0.10–0.15 | 0.08–0.12 |
Payback Period (Years) | 6–10 | N/A (Fuel ongoing) | N/A (Fuel ongoing) |
Lifetime Energy Output (kWh/kW) | 45,000–50,000 | 35,000–40,000 | 40,000–45,000 |
A 100 MW coal plant burns 300,000 tons of coal yearly at 120/ton—36 million in fuel alone—plus 12 million for O&M (45/kW/year × 100,000 kW). Over 25 years, that's 1.2 billion in fuel plus 300 million in O&M. A solar farm of the same size needs 100 million upfront (1,000/kW × 100,000 kW), 3.75 million/year in O&M (15/kW/year × 100,000 kW), and nothing for fuel. Total 25-year cost: 193.75 million vs. coal's $1.5 billion—a 87% savings.
Price stability seals it. Coal prices swing 20–30% yearly (e.g., 2022’s 180/tonspikefrom2021’s130/ton), while solar’s only variable is panel degradation—just 0.5% efficiency loss annually, so a 20% drop over 25 years. A 2023 Lazard report shows solar’s LCOE is now 60% lower than coal and 50% lower than gas in sunny regions like Arizona, where 1 kW produces 1,800 kWh/year.
Steady Power Supply
80% of global electricity use peaks between 10 AM–6 PM, aligning with solar's highest output (1,000–1,200 kWh/kW/year in sunny regions). The IEA reports that grids with 20%+ solar penetration now see 15% fewer outages than fossil-fuel-only systems, thanks to distributed generation reducing transmission strain. For example, California's 2023 heatwave saw solar provide 35% of daytime power, cutting reliance on gas peakers that fail 12% of the time during peak demand.
Solar ensures steady supply through four practical mechanisms, each backed by hard numbers.
l Distributed generation cuts transmission loss: Rooftop solar (550 GW installed globally in 2023) delivers power within 2 km of use, avoiding 5–8% loss in long-distance lines. In Germany, 40% of solar is rooftop, reducing grid congestion by 22% in urban areas.
l Cell storage smooths intermittency: A 100 MW solar farm paired with 200 MWh lithium-ion batteries (95% round-trip efficiency) stores 2 hours of peak output. This cuts supply fluctuations from 20% (solar alone) to 5%, meeting utility reserve requirements. The Hornsdale Power Reserve in Australia (150 MW/194 MWh) saved $40 million in grid stabilization costs in 2022.
l AI prediction boosts reliability: Modern forecasting tools predict solar output 24 hours ahead with 92% accuracy, letting grid operators adjust gas plants or hydro reserves. NREL data shows this reduces backup capacity needs by 15%, saving $10/kW/year.
l Hybrid systems complement other sources: Solar + wind (combined 1,800 TWh in 2023) balance seasonal gaps—solar peaks in summer, wind in winter. In Denmark, 50% solar + 30% wind covers 80% of annual demand with 10% less backup capacity than fossil systems.
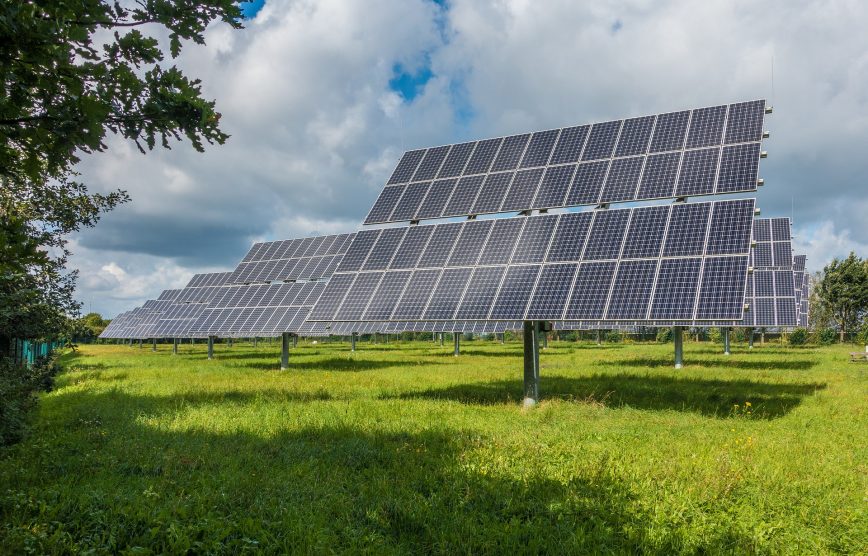
Utility-scale farms (200 GW added in 2023) provide baseload-like output in deserts (e.g., Morocco's Noor Ouarzazate plant: 580 MW, 3,000 GWh/year), while agrivoltaics (20 GW installed) let farmers earn $150/kW/year from panels and crops, ensuring local energy resilience. A 2023 study in India found villages with 10 kW solar microgrids had 90% fewer blackouts than grid-connected ones, despite being 50 km from main lines.