What is the lifespan of solar PV
Solar PV modules last 25–30 years, retaining ~80% output (0.5%/year degradation); inverters need replacing every 10–15 years. Regular cleaning and cooling minimize wear, extending performance and maximizing long-term ROI.
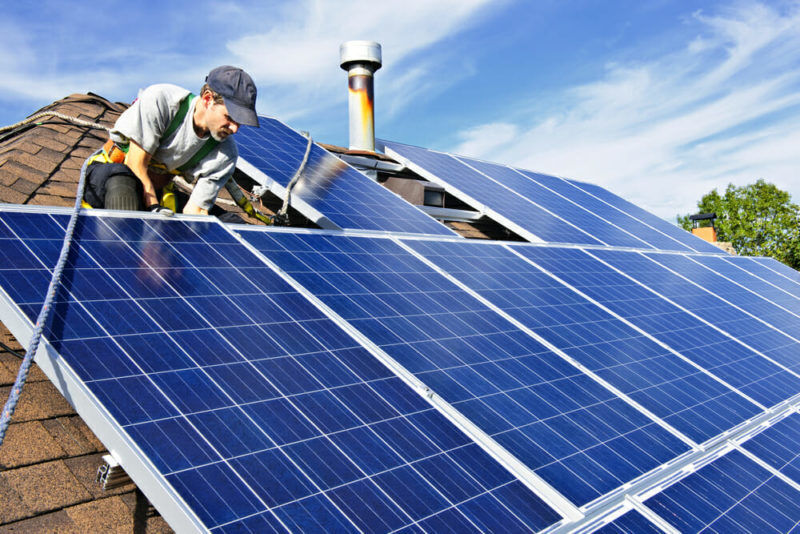
Key Parts of a Solar System
Understanding these parts is crucial because their individual longevity and replacement cycles directly impact your system's 25 to 30-year overall performance and long-term cost. While the solar panels themselves are the stars of the show, designed to last for decades, other modules are the supporting cast that need earlier replacement. The financial performance of your system hinges on this interplay. A panel might still be producing at 85% efficiency after 30 years, but the inverter controlling the whole show will likely have been swapped out at least once.
A standard residential panel measures about 1.7 meters tall by 1 meter wide and weighs approximately 20 kilograms. It's composed of 60 to 72 individual silicon solar cells protected under tempered glass. Their job is purely mechanical: to sit there and reliably generate direct current (DC) electricity from sunlight for decades. They have no moving parts, which is the primary reason for their long functional life of 25 to 30 years or more. Their performance is measured by the degradation rate. Most manufacturers guarantee their panels will still produce at least 92% of their original power output after 12 years, and around 85% after 25 years. This translates to a very slow efficiency loss of roughly 0.5% to 0.7% per year. The aluminum frame and tempered glass are designed to withstand hail stones traveling at 50 miles per hour and snow loads of up to 5,400 Pascals.
The majority of string inverters last between 10 and 15 years. This is why they typically come with a 10 to 12-year warranty, which you can often extend to 20 or 25 years for an additional cost. Microinverters, which are small units attached to each individual panel, often have a longer lifespan, typically 20 to 25 years, and come with warranties to match. Inverter efficiency is also a key metric; modern models operate at peak efficiencies of 97% to 99%, meaning almost all the DC power they receive is successfully converted to usable AC power.
Inverter Type | Typical Lifespan | Standard Warranty | Key Consideration |
String Inverter | 10 - 15 years | 10 - 12 years | Centralized unit; one point of failure for the entire system. |
Microinverters | 20 - 25 years | 20 - 25 years | Distributed system; if one fails, only one panel is affected. |
This is the aluminum and stainless-steel framework that is physically attached to your roof structure and holds the panels in place at the optimal angle, usually between 15 and 40 degrees. This hardware must endure extreme weather—wind loads exceeding 145 kilometers per hour, temperature swings from -30°C to 50°C, and constant UV exposure. High-quality mounting systems are made from aluminum with a protective anodized coating and use stainless-steel bolts (typically Grade 304 or 316) to prevent rust. They are engineered to last the entire life of the solar array, meaning you should never have to replace them if installed correctly. The corrosion rate for these materials is exceptionally low, often less than 0.5 micrometers per year in most environments, ensuring they can easily withstand the system's 30-year lifespan without structural compromise.
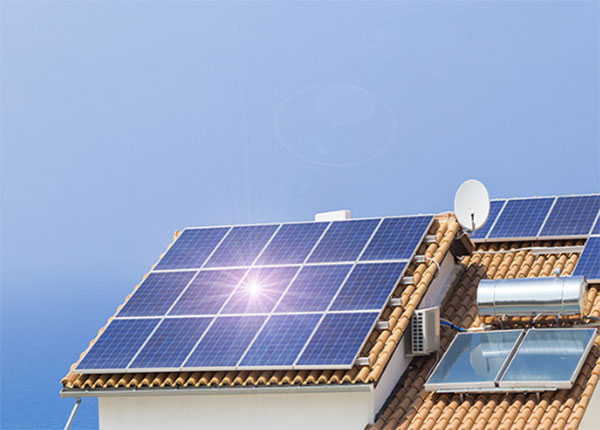
Typical Lifespan: 25-30 Years
The figure of 25 to 30 years is the industry-standard benchmark for a solar panel's useful life, but it's crucial to understand what this actually means. This isn't an expiration date. Your panels won't just stop working in year 26. Instead, this period represents the point at which most manufacturers guarantee their panels will still produce at a significant percentage of their original output—typically around 85%—making continued operation economically viable. This timeline is backed by extensive accelerated stress testing and real-world data from installations dating back to the 1980s. The concept of lifespan here is a blend of physical durability and economic performance. While the hardware itself may continue to generate electricity for 40 years or more, the gradual decline in efficiency, coupled with the potential for newer, more efficient panels to become available, often makes the 25-30 year mark the standard planning horizon for system owners and financiers.
When we talk about a 25-year lifespan, we're primarily referring to the performance warranty provided by the manufacturer. This is a legally binding guarantee that the panels will degrade in a predictable, linear fashion. The most common warranty structure is a guarantee of 90% performance for the first 12 years, followed by a guarantee of 85% performance for years 13 to 25. This translates to an average annual degradation rate of approximately 0.5% to 0.7%. For a 400-watt panel, this means in year 25, it should still be producing at least 340 watts under standard test conditions. It's a promise that the power loss will be slow and manageable. Separate from this is the materials or product warranty, usually also 10 to 12 years, which covers defects in materials and workmanship. The key takeaway is that the 25-year mark is an economic threshold, not a point of failure.
Lifespan Concept | What It Means | Typical Metric | Key Takeaway |
Physical Lifespan | How long the hardware physically lasts. | 30 - 40+ years | The glass and aluminum frame are incredibly durable. Failure is gradual, not sudden. |
Performance Warranty | Guaranteed power output over time. | 25 years (up to 85% output) | This is the financial backbone of your investment. |
Economic Lifespan | The point where operating older, less efficient panels costs more than replacing them. | 25 - 30 years | Future electricity rates and new tech efficiency influence this. |
To offer a 25-year warranty, companies must conduct accelerated lifecycle testing that simulates decades of wear in just a few months. These tests expose panels to extreme conditions: temperature cycles from -40°C to 85°C repeated over 200 times, 1000-hour exposure to damp heat at 85°C and 85% relative humidity, and mechanical load tests exceeding 5400 Pascals (simulating heavy snow). Panels that pass these rigorous tests provide the data confidence for a 25-year promise. From a financial perspective, this lifespan aligns perfectly with most homeowners' plans and loan terms, ensuring the system pays for itself. The payback period for a residential system is typically between 6 and 10 years, leaving 15-20 years of essentially free electricity, resulting in a lifetime net profit of 20,000 to 60,000 for an average-sized system.
Gradual Decline in Power Output
A brand-new 400-watt panel doesn't deliver 400 watts forever. Industry-standard performance warranties account for this, typically guaranteeing that panels will still produce at least 92% of their original output after 12 years and around 85% after 25 years. This translates to an average annual power loss of roughly 0.5% to 0.7%. However, the first year often sees a slightly higher initial drop of about 1% to 2% due to a process called Light Induced Degradation (LID). Understanding this gradual decline is key to forecasting your system's long-term energy production and financial returns over its 25-30 year lifespan.
The gradual loss of power isn't caused by one single thing but by several chemical and physical stresses that accumulate over the 25-year service life. These factors include the constant expansion and contraction from daily temperature swings, prolonged exposure to ultraviolet light, and the potential for moisture ingress. Here are the primary technical reasons behind the decline:
l Light-Induced Degradation (LID): This occurs in the first few months of operation. When boron-doped silicon cells are first exposed to sunlight, the energy causes a rearrangement of oxygen atoms within the silicon wafer, creating a defect that traps electrons. This can cause an initial power loss of 1% to 3% within the first 1,000 hours of exposure. This is a one-time event, and output stabilizes afterward.
l Potential-Induced Degradation (PID): This is a voltage-driven issue. A high voltage difference (often 600 volts or more) between the semiconductor material in the cells and the panel's grounded frame can cause electrons to leak, leading to power losses that can exceed 10% if unchecked. Modern inverters with negative grounding and PID-resistant panels have largely mitigated this problem.
l Ultraviolet (UV) Degradation: The sun's UV radiation, which has a wavelength of about 290 to 400 nanometers, slowly breaks down the molecular structure of the panel's encapsulant—the thin, clear ethylene-vinyl acetate (EVA) layer that protects the cells. This can cause slight browning ("yellowing") over 15-20 years, which reduces the amount of light reaching the cells, contributing about 0.2% to the annual degradation rate.
Each time a panel heats up to 65°C (149°F) on a sunny day and cools down at night, it undergoes thermal cycling. This expansion and contraction, repeated over 9,000 cycles in 25 years, can cause tiny stress fractures (micro-cracks) in the fragile silicon cells. These cracks can grow, breaking electrical connections and reducing the panel's ability to conduct current. Furthermore, even the best seals can slowly allow minute amounts of water vapor to penetrate over a decade or more. This moisture can corrode the thin metal ribbons (busbars) that carry electricity from the cells, increasing electrical resistance. The combination of these factors—UV exposure, thermal cycling exceeding 5,000 cycles, and moisture ingress—is what drives the predictable 0.5% to 0.7% annual power loss.
Factors That Impact Longevity
A panel installed in a cool, overcast climate like Washington state will age differently than an identical panel on a hot, arid roof in Arizona. Similarly, the quality of initial installation—such as the precision of the electrical wiring and the structural integrity of the mounting system—can create a 10 to 15-year divergence in system reliability. Understanding these variables is crucial because they directly impact the rate of power degradation, which can range from a superior 0.25% per year to a problematic 1.0% or more.
Several key elements work in concert to either preserve or diminish your system's productive life. The most significant factors include:
l Ambient Temperature: Heat is the primary antagonist of solar panel longevity. For every 1°C (1.8°F) increase in temperature above the standard test condition of 25°C (77°F), a panel's voltage decreases, and its power output drops by approximately 0.3% to 0.5%.
l Humidity and Salinity: Proximity to the ocean or areas with high humidity accelerates corrosion of the metal modules within the panels and racking systems.
l Mechanical Stresses: This includes constant wind pressure, snow loads exceeding 5,400 Pascals, and the subtle, repeated flexing from thermal expansion cycles.
l Quality of Components: The grade of silicon used, the anti-reflective coating's durability, and the robustness of the bypass diodes all contribute to resilience.
Solar panels are rated at 25°C, but on a sunny day, their internal cell temperature can easily reach 65-75°C (150-167°F). This constant thermal cycling—expanding by a few millimeters each day as temperatures rise and contracting each night—places repetitive mechanical stress on the soldering points connecting the cells. Over 9,000 cycles in 25 years, this can lead to micro-cracks that break electrical pathways. Furthermore, high heat accelerates the degradation rate of the encapsulant (the EVA layer), causing it to discour and lose transparency faster. A panel operating in an average annual temperature of 35°C (95°F) will degrade 20-30% faster than the same panel in a 20°C (68°F) environment.
Climate Factor | Impact on Longevity | Mitigation Strategy |
Hot & Arid (e.g., Arizona) | Highest impact. Accelerated encapsulant degradation and thermal stress. Can increase annual degradation to >0.8%. | Install with elevated racking (≥6 inches) for optimal airflow. Use panels with a low temperature coefficient (e.g., -0.26%/°C). |
Cold & Sunny (e.g., Colorado) | Low impact. Cool temperatures improve efficiency and slow chemical degradation. Annual degradation may be <0.5%. | Standard installation is sufficient. Primary concern is mechanical load from snow (≥5,400 Pa rating needed). |
Humid & Coastal (e.g., Florida) | High impact. Moisture ingress and salt spray corrosion are the main concerns, potentially damaging junction boxes and frames. | Select modules with high corrosion resistance ratings (e.g., Class III or IV for racks). Ensure superior sealing on all connectors. |
An installer using too much torque when tightening bolts on the frame—exceeding the manufacturer's specification of 10-12 Newton-meters—can create stress points that lead to glass cracking years later. Conversely, too little torque can allow the panel to shift in high winds. Improper wiring management, where cables rub against sharp roof tiles or the racking system for years, can lead to insulation wear and dangerous short circuits. Using incompatible modules, like aluminum racking clamped directly to a steel roof flashings without a separating pad, can cause galvanic corrosion that eats through the metal within 5-7 years. The quality of the photovoltaic cells themselves is the final differentiator. Premium panels using N-type monocrystalline silicon have a much lower initial Light Induced Degradation (LID), around 0.5%, compared to 1.5-2.0% for standard P-type cells. This initial advantage, combined with a lower annual degradation rate of 0.3%, means a high-quality panel can deliver 8-10% more energy over a 25-year period than a budget alternative.
Inverter Replacement Timeline
The 25 to 30-year lifespan of your solar panels often comes with a crucial asterisk: you will almost certainly need to replace the inverter at least once. Unlike panels, which have no moving parts, inverters are complex electronic devices that constantly work under significant electrical and thermal stress. They convert the direct current (DC) from your panels into the alternating current (AC) your home uses, operating at peak efficiencies of 97% to 99%. This intense processing generates heat, and the daily thermal cycling—easily exceeding 15°F of internal temperature fluctuation—is the primary reason for their shorter service life. While panels may last 30+ years, the general timeline for a central string inverter replacement falls between 10 and 15 years. Microinverters, with their distributed design, typically last longer, around 20 to 25 years. Factoring in this 1,500to3,000 replacement cost during the system's life is essential for an accurate financial forecast.
A standard string inverter, which handles the output of all 20 to 30 panels centrally, is the workhorse of the system and bears the full load. Its internal modules, like capacitors and transistors, have a finite lifespan degraded by heat. Installing a string inverter in a poorly ventilated space, like a sun-exposed garage where ambient temperatures can consistently reach 100°F, can reduce its lifespan by 2 to 4 years. In contrast, microinverters, which are small units attached to the back of each individual panel, have a different profile. Because they operate in a distributed manner, each unit only handles the output of one panel (e.g., 300 to 400 watts), resulting in less heat generation per unit. Their placement on the roof rack also provides natural airflow and cooling. This is why most microinverters carry a 20 to 25-year warranty, effectively matching the panels' performance warranty period.
Proactive monitoring is your best tool for anticipating a replacement. A gradual 3-5% year-over-year drop in overall system efficiency might be normal panel degradation. However, a sudden 15% or more drop in output, especially if accompanied by error codes on the inverter's display or in the monitoring app, is a strong indicator of an impending failure. Consistently higher internal operating temperatures, visible on some monitoring platforms, also signal that the cooling systems are struggling.
Most string inverters come with a standard 10-year warranty. Many manufacturers offer an extension to 15, 20, or even 25 years for an upfront cost of 200to500. This extended warranty is often a worthwhile investment, effectively pre-paying for a replacement unit and its installation labor. The cost to replace a 7.6 kW string inverter after the warranty expires is typically between 2,000and3,000, including the new hardware and a certified installer's labor for a 4 to 6-hour job. The financial decision hinges on the cost of an extended warranty versus the potential future out-of-pocket expense. Given that inverters have become more efficient over time—gains of 0.5% to 1% every 5 years—a replacement can sometimes slightly increase your system's overall energy production.
Inverter Type | Standard Warranty | Expected Service Life | Typical Replacement Cost (incl. labor) | Key Consideration |
String Inverter | 10 years | 12-15 years | 1,800−3,000 | A single point of failure. Replacement is a single, scheduled event. |
Microinverters | 20-25 years | 20-25 years | 150−300 per unit | Failures are isolated. You may replace only 1 or 2 units over 25 years. |
Power Optimizers | 20-25 years | 20-25 years | 150−250 per unit | Similar to microinverters. If the central inverter fails, optimizers may still need resetting. |
When a 12-year-old inverter fails, you might be offered a refurbished unit as a lower-cost replacement. These units typically carry a 1 to 2-year warranty, compared to a 5 to 10-year warranty on a new model. The efficiency gain of a new inverter might be 1.5%, which for a system producing 10,000 kWh annually, translates to an extra 150 kWh per year.
Maintaining Your Solar Panels
Proper maintenance is the single most impactful factor under your control that determines whether your solar array reaches its full 25 to 30-year potential. Unlike complex mechanical systems, solar PV maintenance is straightforward and primarily preventative. The goal is not to fix broken modules but to proactively prevent issues that can compound over time. A well-maintained system can see a 3-5% higher annual energy output compared to a neglected one, directly boosting your financial return. The good news is that nature handles the most common task—cleaning—for many homeowners. In regions with 25 to 40 inches of annual rainfall, precipitation can naturally wash away 60-80% of the dust and grime that accumulates on panels. However, this passive cleaning has its limits, and a systematic approach to inspection and care is essential for maximizing the system's lifetime energy production, which can exceed 80,000 kWh for a typical 7 kW installation.
A layer of dust, pollen, bird droppings, or leaves creates a shading effect, blocking photons from reaching the solar cells. Studies show that heavy soiling can reduce a panel's efficiency by 5% to 20% or more, depending on local conditions. For a system generating 150 of electricity per month,a 57.50 monthly, or 90 annually,which adds up to 2,250 over a 25-year period. The frequency of cleaning depends entirely on your environment. A home in an arid climate with less than 10 inches of annual rain and frequent dust storms may require cleaning four times a year, while a home in a rainy, temperate climate might need only an annual inspection. The ideal time for cleaning is early morning or late evening when the panels are cool; spraying cold water on a hot panel heated to 150°F (65°C) can cause thermal shock and micro-fractures. Using a hose with deionized water or a soft brush with a long handle is sufficient; high-pressure washers operating above 500 psi can damage the glass surface and void the warranty. The cost of a professional cleaning service typically ranges from 100 to 300 per visit, a cost that should be weighed against the potential energy loss.
Look for any cracks in the glass, which can allow moisture ingress and reduce output by 1-3% per cracked cell. Check that the panel frames have not corroded and that all mounting hardware remains tight; a loose bolt can allow a panel to shift in winds exceeding 50 mph, creating stress points. The most important maintenance tool, however, is your system's performance monitoring software. Modern inverters provide detailed data on energy production. You should establish a baseline for expected output on a clear, sunny day. A sudden, sustained drop in production of 15% or more is a clear red flag indicating a potential fault, such as a faulty inverter, a tripped breaker, or a significant shade issue from a new tree branch. Monitoring allows you to move from reactive repairs to proactive maintenance, identifying issues before they lead to larger energy losses. For example, a 5% gradual decline over a few months could indicate the early stages of a wiring issue or soiling that needs addressing.