What affects solar module efficiency: 5 key factors
Temperature hikes cause 0.3-0.5% efficiency loss/°C; 1mm dust cuts output 5-10%, requiring cleaning. Mono silicon outperforms poly by 2-3%. Suboptimal tilt (vs latitude) reduces yield; light saturation above specs lowers performance, impacting overall module efficiency.
Temperature's Effect on Output
Solar modules are rated for their power output at a standard test condition (STC) of 25°C (77°F). However, on a bright sunny day with an ambient air temperature of 25°C, the surface temperature of a dark solar panel sitting in direct sunlight can easily reach 45°C (113°F) or higher. This excessive heat is a major enemy of efficiency. For every degree Celsius the cell temperature rises above 25°C, the power output typically decreases by a specific percentage, known as the temperature coefficient. This isn't a minor issue; on a scorching 35°C (95°F) day, your panels could be operating at 65°C (149°F), leading to a real-world power loss of 10-15% or more compared to their STC rating.
The primary electrical effect is a steady decrease in the module's voltage as temperature climbs. Since power (in watts) is calculated as Volts x Amps, a drop in voltage directly reduces total power output. It's crucial to check your panel's spec sheet for its temperature coefficient, usually expressed as a percentage per degree Celsius. For example, a high-quality panel might have a power temperature coefficient of -0.30%/°C, while a more budget-friendly panel could be as high as -0.40%/°C. Over a panel's 25- to 30-year lifespan, this difference compounds, with the more efficient panel yielding significantly more energy, especially in hot climates.
Panel Technology | Typical Power Temperature Coefficient | Performance Impact at 65°C (vs. 25°C) |
Monocrystalline (N-type TOPCon) | -0.29%/°C to -0.32%/°C | ~12% power loss |
Monocrystalline (Standard P-type) | -0.35%/°C to -0.40%/°C | ~14-16% power loss |
Polycrystalline (Older Tech) | -0.40%/°C to -0.45%/°C | ~16-18% power loss |
As the table shows, investing in modern N-type monocrystalline panels, which have a superior temperature coefficient, can mitigate losses by 2-4 percentage points on a very hot day compared to older polycrystalline models. A panel mounted flush against a dark roof with minimal airflow underneath will bake in the sun, easily reaching temperatures 10-15°C (18-27°F) higher than a panel mounted with a 4-6 inch air gap for passive cooling. Over a year, a system designed with temperature in mind can deliver 3-5% more total energy than one that ignores it, directly impacting your payback period.
Sunlight Intensity and Panel Angle
At a standard 1000 W/m² of solar irradiance, a panel will perform at its nameplate rating. However, on a perfectly clear day, irradiance might hit 1000 W/m², but on a hazy or partly cloudy day, it can drop to 500-800 W/m², instantly cutting potential output by 20-50%. Furthermore, if a panel is laying flat on a roof, it's like holding a flashlight beam at a piece of paper at a steep angle; the same amount of light is spread over a larger area, resulting in weaker intensity. For a solar panel, this means a significant reduction in the photons available to generate electricity. Getting the angle wrong is one of the most common sources of real-world energy loss, often ranging from 10% to over 30% annually compared to an optimally aligned system.
For a site at 35 degrees latitude, a fixed tilt angle of approximately 30-40 degrees is often the annual sweet spot. However, this is a compromise. The sun's path shifts over 90 degrees from summer to winter. A fixed mount set for the yearly average will inevitably be sub-optimal in every season. The impact is substantial. A panel tilted at 10 degrees in a 35-degree latitude location can lose over 10% of its annual energy yield compared to one set at 35 degrees. The other critical factor is the azimuth angle, which is the compass direction the panels face. In the Northern Hemisphere, a true south azimuth (180 degrees) is ideal for maximizing daily exposure. Deviations matter: a system facing southeast (135 degrees) or southwest (225 degrees) might only see a 2-5% reduction in annual production, but a system facing due east or west could see losses of 15-25% because it completely misses the peak sun hours around solar noon.
A single-axis tracker that follows the sun from east to west throughout the day can increase energy production by 25-35% annually compared to a fixed-tilt system. A more complex dual-axis tracker, which also adjusts for the sun's seasonal height, can boost output by 30-40%. However, these systems come with higher upfront costs, moving parts that require maintenance, and need more space. For most residential installations, the added 15-20% in hardware and installation costs for a single-axis tracker means the payback period might be longer than the energy gains justify.
For the vast majority of rooftop systems, the roof's existing pitch and orientation are the dominant factors. The key is to understand the expected efficiency based on your specific setup. For example, a west-facing roof with a 20-degree pitch in California will still produce over 90% of the energy of an ideal south-facing system, making it a very viable investment, especially if it captures the peak afternoon sun when electricity rates are highest.
The following table illustrates the typical output variation for a 10 kW system at a 40-degree latitude (like Denver, CO or Philadelphia, PA).
Season | Average Sunlight Hours | Estimated Daily Production (10 kW System) | Notes |
Summer | 6.5 - 7.5 peak hours | 55 - 65 kWh | High sun angle, long days. |
Spring/Fall | 5.0 - 5.5 peak hours | 40 - 50 kWh | Moderate sun angle, good production. |
Winter | 3.0 - 4.0 peak hours | 20 - 30 kWh | Low sun angle, short days, potential snow cover. |
For off-grid systems, this variation is the primary design challenge, often requiring cell storage capacity capable of 3+ days of autonomy and a solar array that is 50-100% larger than a grid-tied equivalent to ensure reliable power through the winter months. For fixed-tilt grid-tied systems, a twice-yearly tilt adjustment—setting the angle steeper (latitude +15°) for winter and flatter (latitude -15°) for summer—can recapture an additional 3-6% of annual energy with minimal effort, a simple and effective optimization for ground-mounted arrays.
How Shading Reduces Power
Due to the standard electrical configuration of most solar arrays, a relatively small shadow covering just 5-10% of one panel can lead to a 30-40% power loss for the entire system. This disproportionate loss occurs because solar panels are typically wired together in a series, forming a "string," where the performance of every panel is dragged down by its weakest link. Modern panels incorporate modules called bypass diodes to mitigate this, but these are a band-aid solution, not a cure. Understanding shading is not about achieving perfection; it's about avoiding catastrophic energy loss that can severely impact your system's annual energy production and financial return on investment, potentially reducing it by hundreds of kilowatt-hours per year.
In a string of, for example, 10 panels, the electric current (measured in Amps) must be the same through every panel. When one cell in a panel is shaded, it stops acting as a generator and starts acting as a resistor. This single shaded cell can block the current for the entire panel, and since the panels are in series, it can throttle the current for all 9 other unshaded panels in that string. Bypass diodes help by creating an alternate electrical path around a group of, typically, 20-24 cells within the panel. However, this means you effectively lose the output of that one-third of the panel. Therefore, shading on just a few cells can lead to an 80% loss in a single panel's output, and since that panel's current is now lower, it pulls down the output of every other panel connected to the same string inverter. The voltage of the entire string can also drop significantly, by 20 volts or more, if a bypass diode is forced to activate, pushing the inverter to operate outside its ideal voltage range, further decreasing efficiency.
A soft, diffuse shadow from a leafless tree in winter might cause a 10-15% reduction in output for a panel. In contrast, a hard, sharp shadow from a thin pole or the edge of a chimney can cause an immediate and near-total drop in output for a section of the panel because it completely blocks light to specific cells. The timing and duration are also critical. A shadow that falls on a panel for just 2 hours per day, during peak sun from 11 AM to 1 PM, can reduce that panel's daily energy production by over 50%, as it wipes out the most productive hours.
To combat shading, the solar industry has developed specific technologies that decouple panel performance. The choice here is the single most important factor for shaded sites.
l String Inverters with Power Optimizers: These devices are attached to the back of each panel. If shading affects one panel, the optimizer adjusts the electrical output to find its ideal operating point, preventing it from dragging down the entire string. This can recover 90-98% of the power that would otherwise be lost in a shaded string. The cost is an increase of 50−100 per panel compared to a standard string system.
l Microinverters: This system eliminates the "string" concept entirely by placing a small inverter on every single panel. Each panel operates completely independently. If one panel is 50% shaded and producing 150 watts, the other 29 panels in a 30-panel system can continue operating at their full 400-watt capacity. This is often the highest-performing solution for complex shading, typically adding 0.10−0.15 per watt to the system cost.
If a shadow is expected to cause a 10% annual energy loss on a 10 kW system that generates 14,000 kWh per year (a loss of 1,400 kWh), and electricity costs 0.15 perkWh ,the annual financial loss is 210. Over 25 years, that's 5,250 inlostsavings.Investing anextra 1,500-$2,000 in microinverters or optimizers would be paid back in 7-10 years and would provide a significant net financial gain over the system's life. A professional installer will use a Solar Pathfinder or digital modeling software to simulate shading patterns for every hour of the year, providing a precise percentage loss estimate that makes this technology choice a data-driven decision, not a guess.
Cell Technology and Efficiency Ratings
A 22% efficient panel will generate roughly 10% more power under the same conditions as a 20% efficient panel of the same physical size. This difference is crucial when roof space is limited. Just a decade ago, commercial panels averaged 15-16% efficiency; today, premium models exceed 23%. This nearly 50% increase in relative efficiency means a modern 400-watt panel can produce the same annual energy as an older 270-watt panel in about 30% less physical space.
The core technology behind the silicon cell is the primary differentiator. The market is dominated by two main types, with a third gaining rapid traction due to superior performance.
l Monocrystalline (N-type, like TOPCon or HJT): This is the current high-end technology. N-type cells use a different silicon doping process that makes them less susceptible to a performance degradation issue called Light-Induced Degradation (LID). They typically start with a higher efficiency—22.5% to 23.5% for premium modules—and have a lower power temperature coefficient (around -0.29%/°C), meaning they perform better in hot weather. Their first-year degradation is often only 1%, with an annual degradation rate of about 0.4% thereafter, guaranteeing more power over a 25- to 30-year lifespan.
l Monocrystalline (P-type, PERC): For years, this has been the industry workhorse. PERC (Passivated Emitter and Rear Cell) technology boosted the efficiency of standard P-type cells to the 20.5% to 22% range. While cost-effective, they are more prone to LID, losing about 1-2% of their power in the first few weeks of exposure to light. Their annual degradation rate is slightly higher than N-type, typically around 0.45-0.55%.
l Polycrystalline (Being Phased Out): These panels, with their distinctive blue, speckled look, were the budget leader for years with efficiencies between 15% and 17%. They are less efficient, have a higher temperature coefficient (around -0.40%/°C), and degrade faster. For new installations, they offer little financial advantage given their significantly lower energy density.
A system using N-type TOPCon panels might have a 2-3% higher initial cost per watt than a comparable P-type PERC system. However, because the N-type panels degrade slower and perform better in heat, they will produce 3-5% more electricity annually. Over 25 years, this compounds into a significant energy gain. For a 10 kW system in a sunny climate, this could mean an extra 8,000 to 12,000 kWh of total production, which at a rate of 0.15/kWh trans lates to 1,200 to $1,800 in additional savings, effectively paying for the initial premium.
The most important metric on a spec sheet isn't the peak efficiency, but the performance warranty. A panel warrantied for 92% output after 25 years (0.4% annual degradation) will deliver significantly more energy than one warrantied for 85% after 25 years (0.6% annual degradation), even if they start with the same 400-watt rating.
If you have a large, unshaded roof, a high-quality P-type PERC panel can offer an excellent return on investment (ROI) with a payback period of, for example, 7-8 years. If your roof space is limited or partially shaded, or if you want to maximize the total energy produced over 30 years, investing in N-type technology is the smarter long-term play. The price gap between the technologies has narrowed to just 0.05 to 0.10 per watt, making the superior performance and durability of N-type panels increasingly the default choice for new residential installations aiming for maximum lifetime value.
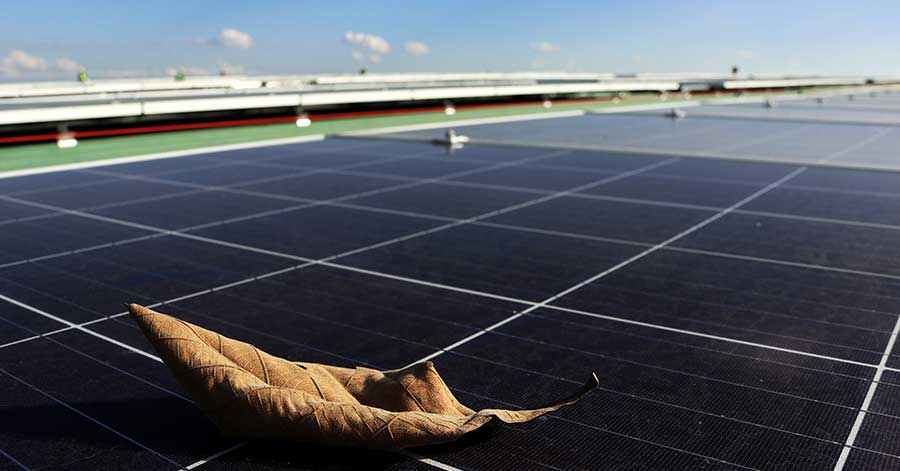
Dust and Dirt: The Gradual Loss
Studies across different climates have shown that without cleaning, soiling can reduce the output of a residential solar array by an average of 3-6% annually. In particularly arid, dusty environments or areas with heavy pollen seasons and infrequent rain, monthly losses can spike to 10-15%, and in extreme cases, a thick layer of dust after a dry spell can block over 30% of the sunlight from reaching the cells. For a 10 kW system that would normally produce 40 kWh on a sunny day, a 5% soiling loss means 2 kWh of wasted energy every single day. Over a year, that adds up to more than 700 kWh of lost electricity, which at a rate of 0.15perkWh is over 100 left on the table annually.
Panels installed at a steeper tilt of 30 degrees or more benefit greatly from natural cleaning by rainfall, as gravity helps water carry away most of the loose dirt. In contrast, panels with a low pitch of 10 degrees or less will retain a much higher percentage of dust and grime, requiring more frequent manual intervention. The frequency and intensity of rainfall is another critical factor. A region with regular, moderate rainfall might only need 1-2 cleanings per year, while a desert climate with less than 10 inches of annual precipitation may require cleaning every 4-6 weeks during dry seasons to maintain peak output.Bird activity can cause highly localized but severe losses; a single droppings streak can create a lasting shadow on the cells beneath it, reducing the output of an entire panel module by 20-40% until it is washed away.
For a typical residential system, a professional cleaning service might cost 150 to 300 per visit. If your system is losing 5% of its annual 1,200energyoutput(60 worth), then paying 200 for a cleaning would not be cost−effective.However,if the soiling loss is estimated at 896 lost), and a $200 cleaning restores that output, the one-year return on investment (ROI) is positive, saving you money from the first year.
Local Environment | Typical Annual Soiling Loss | Recommended Cleaning Frequency | Notes |
Temperate, Regular Rain | 2-4% | Every 12-18 months | Natural rainfall is often sufficient. |
Arid/Dusty, Low Rainfall | 6-10% | Every 4-6 months | Critical during prolonged dry spells. |
Agricultural/High Pollen | 5-8% | Annually (post-pollen season) | Pollen creates a sticky film that rain may not fully remove. |
Urban/Coastal (Near Road or Sea) | 4-7% | Annually | Soot, brake dust, and salt spray require removal. |
If you notice a sustained 5-10% drop in production compared to the expected values for the same time of the previous year (accounting for weather), and the weather has been dry, soiling is the likely culprit. Cleaning panels is not complex; using a soft brush, a squeegee, and deionized water (to prevent mineral spotting) is the best practice.