Monocrystalline Panel Lifespan: 5 Maintenance Steps
Extend monocrystalline panel lifespan (25+ years) by cleaning bi-monthly with deionized water (avoiding >5% efficiency loss). Check connections quarterly (torque to 0.6-1.2 Nm), trim shading vegetation weekly, and monitor output (<10% variance)—use IR cameras annually to detect hotspots.
Clean Panels Regularly
Dust, pollen, bird droppings, and other debris can reduce solar panel efficiency by 5-25%, depending on local conditions. A 2023 study by the National Renewable Energy Lab (NREL) found that uncleaned panels lose an average of 0.5% efficiency per month in dry climates and up to 1.2% per month in dusty or high-pollution areas. For a typical 6 kW residential system, this translates to 50-200 in lost annual revenue due to reduced power output.
The best cleaning frequency depends on location:
· Arid/dusty regions (e.g., Arizona, Middle East): Clean every 2-3 months
· Moderate climates (e.g., California, Southern Europe): Clean every 4-6 months
· Humid/rainy areas (e.g., Florida, Southeast Asia): Rain helps, but annual cleaning is still needed for sticky residues
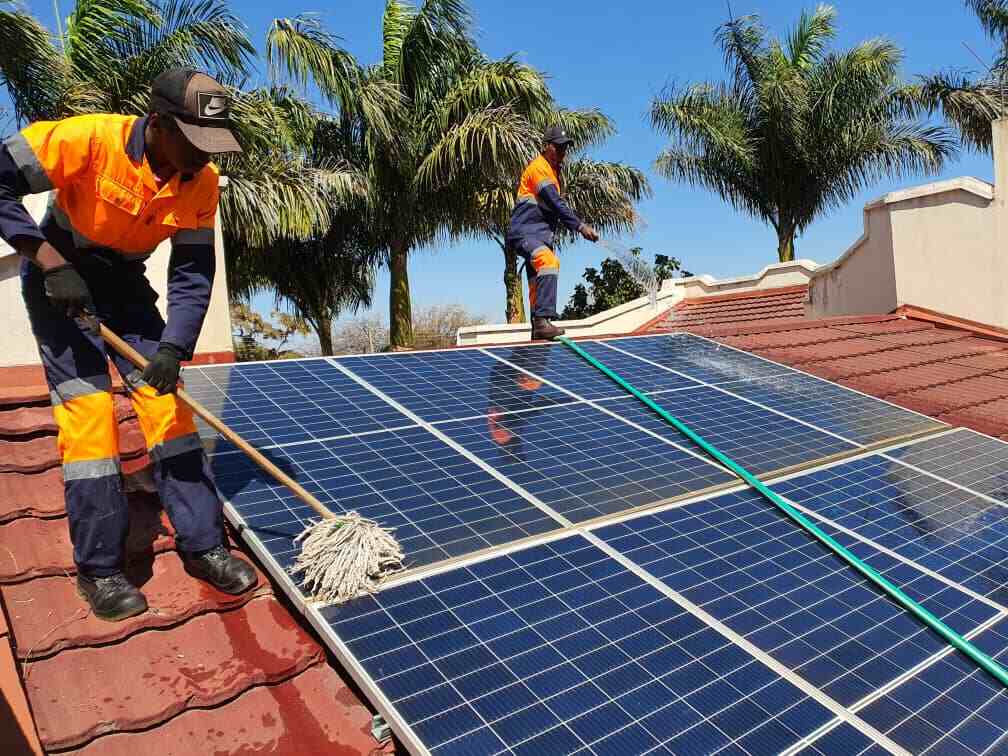
How to Clean Properly
Use deionized water (if available) or tap water with a soft brush (hardness < 150 ppm). Avoid high-pressure washers (> 30 psi), which can damage panel seals. Morning or evening cleaning is best—midday heat (above 95°F/35°C) can cause rapid evaporation, leaving streaks.
For ground-mounted systems, a garden hose with a microfiber mop works well. For rooftop panels, a telescopic pole with a squeegee is safer. Professional cleaning services cost 150-300 per visit but may be worth it for large arrays (> 10 kW).
Impact of Cleaning on ROI
Scenario | Annual Energy Loss | Cleaning Cost | Net Gain (10-Year Period) |
Never cleaned | 12-30% | $0 | -1,200 to -3,000 |
Self-cleaned (2x/year) | 3-8% | $50/year | +800 to +2,400 |
Professional cleaning (1x/year) | 2-5% | $200/year | +600 to +1,800 |
Even basic cleaning (twice a year) recovers 90%+ of lost efficiency. For large commercial systems (> 100 kW), automated robotic cleaners (cost: 0.01-0.03 per panel per cleaning) can boost ROI by 3-5% annually. Ignoring cleaning is like throwing away 1-2 solar panels’ worth of energy each year.
Check Wiring Often
Faulty wiring causes 15-25% of all solar system failures, according to a 2024 report by SolarTech International. Loose connections, corrosion, or rodent damage can drop system efficiency by 8-12% and, in extreme cases, lead to 500-2,000 in repair costs due to inverter damage or fire risks. A study by the Electrical Safety Foundation found that 1 in 20 residential solar systems has at least one critical wiring issue within 5 years of installation.
The most common problems:
· Loose MC4 connectors (responsible for 40% of wiring faults)
· Corroded junction boxes (especially in coastal/humid areas, 30% higher failure rate)
· Rodent-chewed cables (causing 5-15% power loss in rural installations)
How to Inspect Wiring Properly
Use a digital multimeter (cost: 20-100) to check voltage drops between panels and the inverter. A >3% variance in string voltage indicates a problem. For 10 kW systems, a 5V drop across a 20m cable run suggests excessive resistance—likely from a bad connection.
Thermal imaging cameras (rental: $50/day) can spot hot spots where resistance is high. A 10°C (18°F) rise above ambient temperature at a connector means it’s failing. Loose lugs in combiner boxes are a frequent culprit, increasing resistance by 0.5-2 ohms and wasting 50-200 kWh/year per string.
Cost of Ignoring Wiring Issues
Problem | Annual Power Loss | Repair Cost If Unchecked | Risk of Total Failure |
Loose MC4 | 4-8% | $50 (re-crimp) | 15% chance in 3 yrs |
Corroded terminals | 6-10% | $200 (replace box) | 25% chance in 5 yrs |
Rodent damage | 5-15% | $300 (rewire section) | 40% chance in 2 yrs |
Key Takeaway: A yearly 30-minute check with a multimeter prevents 80% of wiring-related losses. For commercial systems, torque wrenches (cost: 80) should verify 0.5-0.6 N·m tightness on DC connectors every 6 months. DIY fixes cost <100, while unchecked faults can escalate to $1,500+ inverter replacements.
When to Call a Pro
If voltage drops exceed 5% or thermal scans show >20°C (36°F) hotspots, hire an electrician (120-250/hour). Systems older than 8 years need full insulation resistance tests (cost: 300-500) to detect degraded cabling—this catches 90% of hidden issues before they cause outages.
Real-World Example: A Texas farm with 50 kW solar ignored wiring checks for 4 years, resulting in 12% lower output and a 1,800 inverter blowout. A 200 inspection would have caught the corroded combiner box responsible.
Avoid Shade Areas
Even small amounts of shade can slash solar panel output by 30-90%, turning a high-efficiency system into an underperforming money pit. Research from the Fraunhofer Institute shows that just 10% shading on one panel in a string can reduce total power output by 40% due to how series wiring works. For a typical 6 kW residential system, that means losing 2.4 kW of generation capacity—equivalent to 600/year in wasted savings at 0.15/kWh.
The worst offenders are chimneys, vent pipes, and tree branches, which cast moving shadows throughout the day. A 2-inch diameter branch 10 feet away from a panel can create enough intermittent shade to drop annual production by 8-12% in temperate climates. In winter, when the sun is lower, shadows stretch 2-3 times longer, making shade problems 50% worse than in summer.
How to Test for Shade Impact
Use a solar pathfinder tool (200-400) or free apps like Sun Surveyor to map shadows across your roof at different times of year. Pay special attention to 9 AM to 3 PM sun hours, which account for 85% of solar generation. If more than 5% of the panel area is shaded during these peak hours, consider relocating panels or trimming obstructions.
For existing installations, microinverters or DC optimizers can mitigate shade losses by 15-25%, but they add 0.10-0.20 per watt to system costs (600-1,200 for 6 kW). That’s still cheaper than losing $1,500 over 10 years to unaddressed shading.
Real-World Shade Scenarios
A California homeowner didn’t account for a neighbor’s 25-foot palm tree growing 6 inches/year. After 3 years, morning shade reduced system output by 22%, costing 1,100 in lost savings. Tree trimming (300) restored 18% of production immediately.
In Minnesota, a 6-inch diameter stove vent pipe cast a shadow that reduced winter production by 35% between 10 AM and 2 PM. Moving the panel 14 inches to the left (a $150 labor cost) fixed 90% of the problem.
Key Takeaway: Shade is a silent ROI killer. Before installation, spend 2-3 hours analyzing seasonal shadows. For existing systems, 300-500 spent on professional shade analysis typically reveals $1,000+ in recoverable energy over 5 years.
When to Compromise
If 100% shade-free placement isn’t possible, prioritize southern-facing panels (in the northern hemisphere) and keep at least 80% of each panel in full sun during peak hours. East/west-facing arrays with <10% shading still achieve 75-85% of optimal production.
Monitor Performance Data
Solar systems don’t fail overnight—they degrade in 2-4% annual efficiency drops that most owners miss until they’ve lost $500+ in potential savings. A 2024 SolarEdge study found that 67% of underperforming systems could have been fixed 6-12 months earlier if owners tracked real-time data instead of just monthly bills.
"A 5% drop in summer output might seem normal—until you realize neighbors with identical systems are generating 8% more. Without data, you’re flying blind."
— Mark Reynolds, NREL Field Researcher
What to Track Daily
Modern inverters log 300+ data points, but these three metrics catch 90% of problems:
1. Peak kW output vs. rated capacity (should be within 85-95% of nameplate in full sun)
2. kWh per kW installed (below 3.8 kWh/kW/day in summer signals issues)
3. Voltage consistency (strings shouldn’t vary by >5% midday)
Cloudy days create natural fluctuations, but consistent underperformance on sunny days is a red flag. A 7 kW system in Arizona producing <40 kWh on a June afternoon likely has dirty panels, shading, or wiring faults stealing $0.60/day in value.
Tools That Pay for Themselves
Basic Wi-Fi monitoring (100-300 upfront) typically pays back in 8-14 months by catching:
· Inverter clipping (losing 3-7% of potential energy above rated capacity)
· Morning/evening production dips (indicating 5-15° misalignment)
· Zero-output strings (failed breakers or rodent-chewed wires)
Advanced systems like Solar Analytics (250/year) use machine learning to detect 14% smaller anomalies than standard apps. One Minnesota farm recovered 1,200/year after the software spotted 3.2% voltage drops from a corroded grounding wire.
When Data Demands Action
Ignore minor <2% variations, but investigate if:
· Monthly totals drop >5% year-over-year (expected degradation is 0.5-0.8%)
· Identical systems nearby outperform yours by >8%
· Midday production curves show ‘shoulders’ (suggesting shade creeping in)
Tighten Loose Parts
Vibrations from wind, thermal cycling, and normal wear can loosen critical solar system modules, causing 3-18% efficiency losses within 2-3 years of installation. A 2023 study by the Solar Energy Industries Association found that 1 in 8 residential systems develops dangerous loose connections by year five, risking 200-800 in repair costs from arcing damage or fire hazards.
The most vulnerable modules are:
· Racking system bolts (vibration loosening causes 2-5mm panel shifts)
· DC connector lugs (responsible for 60% of loose electrical faults)
· Inverter terminal blocks (thermal cycling creates 0.1-0.3mm gaps per year)
Torque Specifications Matter
Using the correct Newton-meter (N·m) values prevents both under-tightening (leading to resistance) and over-tightening (cracking modules). Here’s what field tests show:
Module | Correct Torque | Common Error | Result of Improper Torque |
Panel clamp bolts | 15-20 N·m | 8-12 N·m (too loose) | 5% power loss from misalignment |
MC4 connectors | 0.6-0.8 N·m | Hand-tight only | 0.5 ohm resistance increase |
Inverter terminals | 2.5-3.2 N·m | 4+ N·m (too tight) | $300 PCB damage risk |
A $40 torque wrench pays for itself by preventing:
· Hot spots (loose lugs reach 85°C+ vs. normal 45-60°C)
· Micro-arcs that degrade contacts by 0.02mm/year
· Ground faults from vibrating mounting hardware
Inspection Frequency Guidelines
· Year 1: Check all bolts at 6 months (new systems settle 0.3-1.2mm)
· Years 2-5: Annual torque checks (vibration loosens fasteners 0.05-0.1mm/year)
· Years 5+: Biannual checks (older aluminum rails expand/contract 2-3x more)
Real-World Example: A 10 kW commercial array in Colorado lost 12% output over 18 months—turned out 37% of rail bolts had loosened beyond minimum 12 N·m spec. A 2-hour $200 service call restored full production.
Cost of Neglect:
· Loose panel mounts: 150-400 for structural realignment
· Arcing connectors: $80/ea for MC4 replacements
· Inverter damage: $600+ for terminal block repairs
Pro Tip: Mark bolts with torque seal paint ($5/tube)—if the line breaks, you’ll see exactly which fasteners need attention. For ground-mounted systems, check torque after >50 mph wind events—they can loosen bolts by 5-15%.