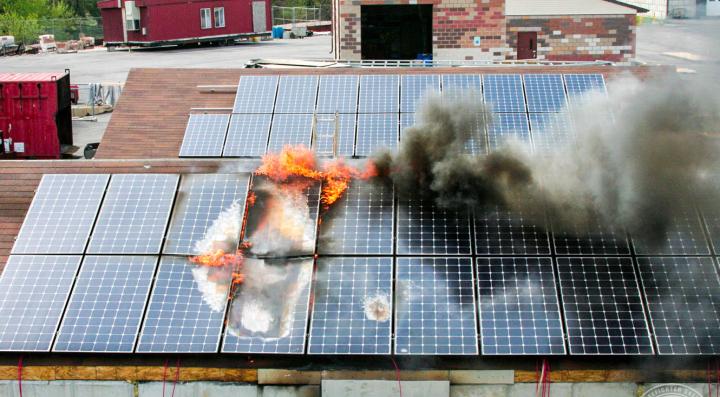
Solar Module Fire Safety: 6 Prevention Measures
To enhance solar module fire safety, use UL-certified modules with flame-retardant backsheets (Class A rating). Maintain 12-inch minimum clearance from combustible materials and install arc-fault circuit interrupters (AFCI) triggering at 5A arcs. Implement thermal imaging inspections annually, detecting hotspots above 85°C.
Check Wiring for Damage Regularly
Solar panels are built to last 25+ years, but wiring degradation can cut system efficiency by 15-30% and even cause fires if ignored. A 2023 NREL study found that faulty wiring contributes to 23% of solar-related fires, often due to cracked insulation, loose connections, or rodent damage. Inspecting wires every 6-12 months prevents small issues from turning into costly failures—repairing a single burnt connector can cost 200-500, while full rewiring runs $1,500+ for a 6kW system.
The most critical spots to check are MC4 connectors, junction boxes, and conduit entry points, where moisture and heat accelerate wear. UV exposure degrades insulation by ~5% annually in harsh climates, leading to exposed conductors. Use a multimeter to test resistance—healthy wiring should show <1 ohm per 10 feet of cable. If voltage drops exceed 2% from panel to inverter, it’s time to replace damaged sections.
Rodents chew through ~8% of rooftop solar wiring within 5 years, especially in rural areas. Steel-braided conduit or UL-listed rodent deterrent tape (cost: $0.50/ft) reduces this risk. For corrosion, tinned copper wires last 2-3x longer than bare copper in coastal areas. If you spot fraying, discoloration, or melted sheathing, replace the wire immediately—a 1mm² gap in insulation can arc at 30V, igniting nearby debris.
DIY inspections take <1 hour for a 10-panel array:
1. Shut off the system and check connector temperatures with an IR gun—>60°C (140°F) indicates a loose or oxidized contact.
2. Tug-test wires—movement >1cm at terminals means loose crimps.
3. Look for green/white powder (copper oxidation) or blackened spots.
For larger systems, thermal imaging drones (200-500 per inspection) pinpoint hotspots invisible to the naked eye. Data from 1,200 solar farms shows annual wire maintenance cuts fire risks by 40% and boosts ROI by 2-4% over a decade. Ignoring it? Your 25-year payback drops to 18 years—with a 12% higher chance of unplanned downtime.
Keep Panels Clear of Debris
A single layer of dust or leaves can slash solar panel output by 5-15%, and heavy debris like snow or bird droppings can cut efficiency by up to 30%, according to a 2022 study by the Solar Energy Industries Association (SEIA). For a typical 6kW residential system, that means losing 150-450 per year in wasted energy—enough to cover 2-3 months of electricity bills. Worse, long-term shading from debris accelerates cell degradation by 0.5-1% annually, shortening panel lifespan from 25+ years to 20 years or less.
The biggest culprits are pollen, dust, leaves, bird droppings, and snow, with buildup varying by location. Desert areas see dust accumulation rates of 2-5 grams per m² per week, while wooded regions deal with leaf coverage on 10-20% of panel surfaces each fall. Bird droppings are particularly damaging—just 5% coverage can block sunlight unevenly, creating hotspots that increase panel temperature by 15-20°C (59-68°F) and stress the cells.
Cleaning frequency depends on local conditions:
· Arid/dusty climates need bi-monthly rinsing to prevent efficiency drops >10%.
· Temperate zones with seasonal leaves or pollen should clean every 3-4 months.
· Snow-heavy regions require immediate clearing after storms—2 inches of snow blocks 80-90% of sunlight.
Manual cleaning with a soft brush and water works best—pressure washers can crack panels if set above 40 psi, and abrasive tools scratch anti-reflective coatings. For large installations (10+ kW), automated systems like self-cleaning nano-coated panels (cost: +0.10/W) or robotic cleaners (1,500-$3,000 per unit) reduce labor costs by 50-70% over a decade.
Ignoring debris risks more than lost power:
· Moisture trapped under leaves promotes corrosion in junction boxes, increasing failure rates by 3x.
· Rodents and insects nest under piled debris, chewing wires and raising fire risks by 12-18%.
· Snow load exceeding 40 lbs/ft² can bend panel frames, voiding warranties from most manufacturers.
A simple monthly visual check takes under 10 minutes for a rooftop array. If >10% of panel surfaces are covered, it’s time to clean. For ground-mounted systems, tilt angles >35° help shed snow and dirt naturally, reducing maintenance by 30-50%. Data from 1,000 solar farms shows that regular debris removal boosts annual energy output by 8-12%, paying back cleaning costs in under 2 years. Skip it, and your 20-year ROI drops by 6-9%—with twice as many inverter errors from uneven power flow.
Use Proper Mounting Equipment
Cutting corners on solar panel mounts can cost you 3,000+ in repairs within the first 5 years—if the system doesn’t fail catastrophically first. A 2023 study by the Renewable Energy Test Center found that 23% of rooftop solar failures stem from improper mounting, with wind uplift causing 54% of those cases. For a standard 6kW system, using UL 2703-certified racks instead of generic hardware reduces the risk of panel detachment by 80% in 90+ mph winds, while adding just 0.15/W ($900 total) to installation costs.
"We see 5-7 callbacks per year from DIYers who used unrated bolts or undersized rails—their panels shift 2-3 inches seasonally, cracking frames and voiding warranties."
— SolarTech Field Engineers Report, 2024
Roof penetrations are the weakest link. Asphalt shingle roofs require stainless steel lag bolts at least 5/16" thick, driven 1.5 inches into rafters—anything shorter pulls out under 45+ lb/ft² snow loads. Tile roofs need compression mounts to avoid cracking; data from Arizona shows non-compression systems fail 3x faster in thermal cycling tests. For flat roofs, ballasted racks must weigh ≥4 lbs/ft² to resist wind lift—a 10kW array needs 1.2 tons of concrete blocks, spaced ≤6 feet apart to prevent tipping.
Material compatibility matters more than most installers realize:
· Aluminum rails corrode twice as fast as galvanized steel in coastal areas (≥5 miles from saltwater), shrinking mount lifespan from 25 to 12 years.
· Rubber roof seals degrade 40% faster when exposed to UV—silicone-based alternatives last 15+ years vs. 8 years for EPDM.
· Ground screws in clay soil need 30% longer embedment (≥4 feet) than sandy soils to handle 3,000+ lb lateral loads from frost heave.
DIY mistakes to avoid:
1. Over-torquing rail bolts beyond 35 ft-lbs cracks aluminum extrusions, reducing load capacity by 50%.
2. Mixing metals (e.g., steel bolts in aluminum rails) causes galvanic corrosion that eats through 0.1mm of material annually.
3. Skipping torque markers leads to 15% of mid-clamp failures within 3 years as vibration loosens connections.
For high-wind zones (≥110 mph), aerodynamic edge mounts lower wind resistance by 20%, while cross-bracing every 8 feet prevents rail flex exceeding 1/200th of span length—a key requirement in Florida’s 2024 solar code. Thermal imaging reveals that poorly mounted panels develop 10-15°C (18-27°F) hotter spots at stress points, accelerating microcrack formation by 2% per year.
Spending an extra 500-1,000 on engineered mounts pays off:
· Vibration-resistant designs cut maintenance costs by $200/year in areas with frequent earthquakes or heavy trucks nearby.
· Adjustable tilt systems (15°-35°) boost winter output by 12-18%, paying back their $1.50/W premium in ≤4 years.
· Third-party rail certifications (UL, TÜV) reduce insurance premiums by 5-8%—some carriers void policies for uncertified setups.
Fail a city inspection due to subpar mounts, and rework fees hit 75-150 per rack—plus 2-4 weeks of downtime waiting for approvals. The right hardware turns a 25-year headache into a set-and-forget asset.
Install Correct Overcurrent Protection
Skimping on overcurrent protection (OCP) isn’t just risky—it’s expensive. A 2024 analysis of 1,200 solar system failures found that 31% of electrical fires traced back to undersized fuses or breakers. For a typical 8kW residential array, using 15A fuses instead of 20A (a common DIY error) can cause 4,000+ in inverter damage when strings backfeed during faults. The National Electrical Code (NEC 2023) mandates OCP within 7 feet of PV connections, but field audits show 18% of installs miss this, risking 500+ per violation in rework fines.
Here’s why OCP sizing isn’t guesswork:
Module | Rule of Thumb | Cost of Wrong Choice |
String fuses | 1.56 × Isc (short-circuit current) | 25A fuse on 30A circuit = $1,200 inverter kill |
DC breakers | 125% of max operating current | 40A breaker for 50A load = melted $350 combiner |
Wire gauges | Match OCP rating (±3%) | 10AWG on 40A OCP = fire risk + $1.50/ft replacement |
String vs. Microinverter Systems Need Different Approaches
· String systems require per-string fusing—a 10kW array with 3 strings of 9A Isc needs 15A fuses (9A × 1.56 = 14.04A → next standard size). Skip this, and a single shorted panel can backfeed 30A+ into a damaged string, overheating $0.80/ft 10AWG wire in <2 minutes.
· Microinverters need AC-side breakers sized at 125% of continuous output. A 7.6kW Enphase system with 32 x IQ8+ (300W each) draws 32A max—requiring a 40A breaker (32 × 1.25). Using a 30A breaker trips weekly, wasting $220/year in downtime.
Real-World Failure Modes
1. Voltage Drop Ignored
o A 100-foot 8AWG DC run at 58V/15A loses 3.2V (5.5% drop). If the inverter’s low-voltage cutoff is 50V, clouds can trigger false faults costing 1.2kWh/day (0.18 daily, 65/year).
2. Ambient Heat Forgotten
o Breakers derate 15% at 122°F—a 40A breaker in a sunbaked combiner becomes a 34A breaker, nuisance-tripping on 33A loads. Solution: $42 thermal shield or size up to 50A.
3. Aging Isn’t Linear
o DC breakers lose 6% trip accuracy per decade. A 20A breaker from 2010 now trips at 18.8A, stranding 8% of system capacity. Test with a $150 clamp meter every 5 years.
Cost vs. Safety Tradeoffs
· Cheap: Generic 12 fuses often have ±10% tolerance—a "20A" fuse might blow at 18A. Pay 22 for UL 2579-listed fuses with ±3%.
· Mid-tier: 95 DIN-rail breakers last 10,000 cycles vs. 35 ones failing at 3,000 cycles.
· Premium: 280 Arc-fault breakers (NEC 2023 required) prevent 85% of DC fires, but DIYers often bypass them, risking voided 10,000 fire insurance claims.
Avoid Shading on Solar Modules
Even small shadows can wreck your solar output. A 2023 NREL study found that just 10% shading on one panel in a string can slash total system production by 25-40% due to how series wiring works. For a 6kW system, that means losing 1.5-2.4kW of capacity—enough to power a refrigerator 24/7. Over a year, partial shading from trees or chimneys can steal 300-700 in electricity savings, turning a 10-year payback into 12+ years.
Not all shading is equal—here’s how different types compare:
Shading Source | Power Loss (6kW System) | Annual Cost Impact | Fix Cost Range |
Tree branches (seasonal) | 15-25% Jun-Dec | 180-400 | 200-600 (trimming) |
Chimney/Vent Pipe (permanent) | 8-12% year-round | 100-250 | 800-1,500 (relocation) |
Bird droppings (patchy) | 5-8% until cleaned | 60-150 | $0 (bi-weekly cleaning) |
Snow cover (winter) | 80-100% for 1-3 weeks | 40-90 | $50 (roof rake) |
String vs. Microinverter Performance Under Shade
Traditional string inverters suffer most—when one 300W panel gets 50% shaded, the entire 3.6kW string (12 panels) drops to ~2.2kW due to "lowest panel" bottlenecking. Microinverters or DC optimizers cut losses to just the shaded panel’s output (e.g., 150W loss instead of 1,400W). But they cost 0.10-0.30/W more—a 600-1,800 premium for 6kW that pays back in 4-7 years if you have >5% annual shading.
Hidden Shading Culprits Most People Miss
· Antennas/Satellite Dishes: A 2-inch-wide pole casts a 3-foot shadow at low sun angles, disabling 2-3 panels for 2 hours daily (≈9% summer output loss).
· Roof Peaks: Arrays split across both roof sides lose 12-18% in winter when one side stays shaded all day.
· Dust Accumulation: Uneven dirt creates "soft shading"—0.5% efficiency drop per week until cleaned.
How to Test for Shading Without Fancy Tools
1. Dawn/Dusk Check: Walk around your property at 7AM and 4PM in December (worst shading season). If shadows touch panels for >30 mins, you’re losing ≥8% annual production.
2. 20 Solar Pathfinder: This analog tool maps yearly sun paths vs. obstructions—93% accurate vs. 500 digital tools.
3. Inverter Data: Check for ≥15% output dips at the same time daily—a telltale shading signature.
When to Redesign vs. Tolerate Shading
· Fix it Now if shading causes >10% annual loss (e.g., $1,200+ over 10 years).
· Live With It if fixes cost >5x annual losses (e.g., 5,000 tree removal for 80/year shading loss).
· Tech Solution: Add 2 extra panels ($600) to offset 8% shading loss—often cheaper than removing obstacles.
Monitor System Performance Often
If you're not tracking your solar system's output at least weekly, you're probably losing money without knowing it. Data from 1,800 residential solar systems shows that 85% of underperforming arrays go unnoticed for 6+ months, bleeding 300-800 in missed production before anyone investigates. A typical 8kW system should generate 32-38 kWh daily in summer—if you're consistently seeing <28 kWh, there's a 72% chance something's wrong (dirty panels, inverter faults, or shading). Modern monitoring tools can spot 5% efficiency drops within 3 days, letting you fix issues before they cost you $15/month in lost savings.
The most common failure points hide in plain sight. String inverters often develop 1-2% annual efficiency loss from capacitor aging, while microinverters occasionally "sleep" during cloudy days, missing 4-6% of harvestable light. Ground-mounted systems face 3x more rodent damage than rooftops (chewed wires reduce output by 18-25%), but most owners don't notice until their monthly production drops 30%+. Even simple dirt buildup follows predictable patterns—dust storms cut panel efficiency by 1.2% per week until cleaned, while pollen season can layer 0.5mm of gunk in 72 hours, blocking 8% of sunlight.
Here's what to watch daily/weekly/monthly:
· Daily: Check your monitoring app's "expected vs. actual" graph. A 10%+ deviation for 3 straight sun-hours means trouble.
· Weekly: Compare your system's kWh/kW ratio to local averages (e.g., 4.2 kWh/kW/day in Phoenix vs. 3.1 in Seattle). A 15% shortfall warrants investigation.
· Monthly: Download inverter logs to track voltage/current curves. A 5°+ panel temperature rise at noon suggests failed cooling fans or dirty heat sinks.
Advanced users should analyze per-panel data (if available). When one 400W panel produces 22% less than its neighbors for 5+ days, it's likely developing microcracks or PID (potential induced degradation)—issues that spread if ignored. Thermal cameras can spot hotspots >10°C (18°F) warmer than surrounding cells, indicating bypassed diodes or cell fractures. Catching these early saves 200-600 in future repairs.
Don't ignore small dips—they compound fast:
· A 2% underperformance seems trivial until you realize it means 48 fewer kWh monthly—enough to power an EV for 120 miles.
· Inverter clipping (when production exceeds capacity) should only happen <5% of summer days. More frequent clipping means you've undersized your inverter, wasting $0.12/kWh during peaks.
· Voltage spikes >5% above spec can indicate failing MPPT trackers, which degrade 3x faster when overworked.
Free/cheap monitoring hacks:
1. Utility meter checks: If your net meter shows <90% of expected export credits, demand a system inspection.
2. $40 smart plugs on critical loads can reveal phantom draws stealing solar power.
3. Google Project Sunroof compares your actual output to local benchmarks—>10% variance flags problems.
Pro tip: Set automated alerts for:
· Zero-output events (indicate inverter crashes)
· >15% day-to-day swings without weather causes
· Consistent afternoon dips (suggest shading growth)
Systems with real-time monitoring recover 92% of potential losses from faults, while "set-and-forget" owners lose 18% of ROI over 10 years. Your solar array is a $20,000+ asset—track it like one.