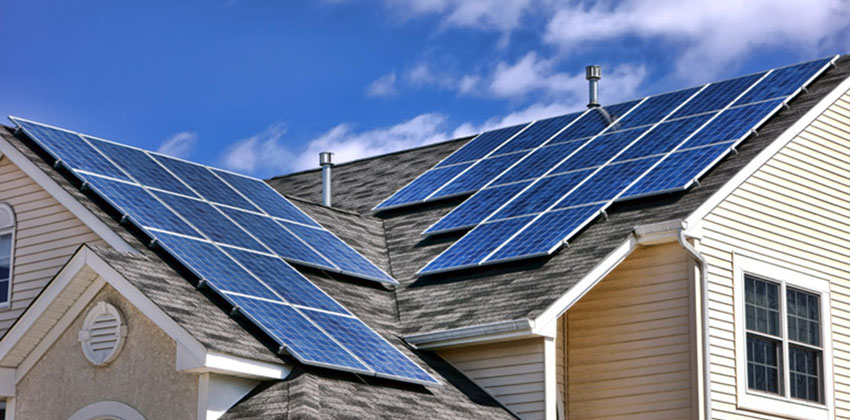
How to Choose a Monocrystalline Solar Module | Wattage, Efficiency, Durability
Choose monocrystalline modules: 300-500W wattage, 22-24% efficiency (outperforms polycrystalline), check -0.3%/°C temp coefficient, and confirm 25-year power warranty for heat resilience and lasting value.
Wattage
In 2023, global newly installed PV capacity exceeded 290GW, with monocrystalline silicon modules accounting for 92% of the market share. The metric "Wattage" refers to the peak DC output under Standard Test Conditions (STC: irradiance 1000W/m², 25°C, AM1.5).
For example, a 540W module generates 0.54 kWh per hour, which is over 80% more annual energy generation compared to the mainstream 300W modules of 2015.
Choosing the wrong wattage can lead to low-power modules failing to meet electricity demands, or high-power modules wasting resources due to installation area constraints.
What is Solar Module Wattage
In simple terms, a solar module's wattage is its rated value for "how much electricity it can generate." But this isn't an arbitrary number – the industry has a strict definition: Wattage refers to the maximum DC power a monocrystalline silicon module can output under Standard Test Conditions (STC), and the unit is typically "Watt-peak" (Wp).
Measurement of Wattage
The global PV industry uniformly adopts STC as the testing benchmark. This standard acts like a "ruler," ensuring data from modules of different manufacturers can be directly compared. STC includes three parameters:
· Irradiance 1000W/m²: Equivalent to solar radiation intensity around noon on a cloudless day. To simulate this condition, laboratories use "solar simulators."
· Cell Temperature 25°C: The power generation efficiency of solar cells is closely related to temperature; higher temperatures lead to lower power. During testing, modules are cooled or heated to 25°C to eliminate temperature interference.
· Air Mass AM1.5: Simulates the state of sunlight after passing through the atmosphere in mid-latitude regions (e.g., Europe, most of the US). A lower AM (Air Mass) value indicates stronger sunlight, and AM1.5 is the most commonly used reference condition in the PV industry.
For example, a module labeled "540 Wp" will stably output 540 watts of DC power when connected to professional equipment under STC conditions. This value is recorded in the module's technical datasheet and serves as the basic reference for user selection.
Meaning of the Wattage Value
One might ask, how is this different from an air conditioner's "1.5 horsepower" or a refrigerator's "200W power consumption"? Simply put, a module's wattage indicates its "power generation capability," not its "power consumption." An air conditioner's 1.5 HP refers to its cooling power, whereas a module's 540Wp means it can generate that much electricity.
During actual operation, the environment rarely perfectly matches these three parameters. For instance, summer noon irradiance might exceed 1000W/m², but cell temperature might rise to 50°C; on a cloudy winter day, irradiance might be only 200W/m². In these cases, the module's actual output power will be far lower than 540Wp.
Actual Power Generation
The power of monocrystalline silicon modules decreases as temperature increases, quantified by the industry using the "temperature coefficient." The temperature coefficient for mainstream modules is approximately -0.3% to -0.5%/°C (the negative sign indicates power decreases by 0.3%-0.5% per C temperature increase).
Assume a 540 Wp module operates at full power under STC (25°C). When the temperature rises to 50°C (common in summer), a 25°C difference, the power will decrease by: 540Wp × 0.4%/°C × 25°C ≈ 54Wp, resulting in an actual output of about 486Wp, a decrease of nearly 10%.
The effect of irradiance is simpler: if irradiance is only 800W/m² (e.g., cloudy weather), the module power will decrease proportionally to 540Wp × (800/1000) = 432Wp.
Besides temperature and irradiance, module aging also causes power degradation. The power of a new module as it leaves the factory is the "initial power," after which it naturally decreases annually. According to International Electrotechnical Commission (IEC) standards, the annual degradation rate for monocrystalline silicon modules is typically ≤0.4% (the first year might be slightly higher, around 2%). A 540Wp module will have approximately 540Wp × (1 - 2% - 24 × 0.4%) ≈ 540 × 0.88 = 475Wp remaining after 25 years, retaining 88% of its initial power.
How Technology Pushes the Numbers Higher
Back in 2010, mainstream monocrystalline silicon modules had a wattage of only around 200Wp. At that time, silicon wafers were small (156mm) and cell efficiency was low (about 18%). With technological advancements, wattage has increased year by year:
· 2015: 166mm wafers + widespread adoption of PERC cells pushed mainstream module wattage to 300Wp, with efficiency increasing to 20%.
· 2020: Application of 182mm large-size wafers + TOPCon cells saw mainstream wattage break through 500Wp, with efficiency reaching over 23%.
· 2023: 210mm wafers + HJT cell trial production; some module wattages are approaching 600Wp, with efficiency exceeding 24%.
Relationship Between Wattage and Energy Generation
Users are probably most concerned with: "If I install a 540Wp module on my roof, how many kilowatt-hours can it generate per day?" This depends on local sunshine hours and system efficiency.
Assume a location has an average of 4 effective daily sunshine hours (i.e., "peak sun hours"), and system efficiency (including inverter loss, line loss, dust shading, etc.) is calculated at 80%:
Daily energy generation (kWh) = Module power (kWp) × Sunshine hours × System efficiency
= 0.54 kWp × 4 h × 0.8 ≈ 1.728 kWh/day
Approximately 51.8 kWh per month, and about 622 kWh per year.
If there are consecutive rainy/cloudy days and sunshine hours drop to 2 hours, daily generation would drop to 0.54 × 2 × 0.8 ≈ 0.864 kWh.
Determining the Right Wattage Module
When considering installing solar panels, the first step isn't to look at advertisements boasting "600W high power," but to first figure out: What wattage module does my home actually need? If this calculation is wrong, you might install too few and not meet your needs, or install too many and waste money.
First, Calculate Your Daily Electricity Usage
Start by checking your electricity bill. Most US household bills provide monthly electricity consumption in "kilowatt-hours" (kWh). For example, a typical US household uses 1100 kWh per month on average, which is about 1100 ÷ 30 ≈ 36.7 kWh per day. But this is just an average; consider seasonal fluctuations – usage might rise to 1300 kWh/month in summer with AC, or 1200 kWh/month in winter with heating. It's recommended to take the average daily usage of the highest month throughout the year, for example, 38 kWh/day in summer, to ensure coverage even during extreme weather.
If you've just moved into a new home and lack historical data, you can estimate: Basic electricity usage for lighting, refrigerator, TV, etc., is about 10 kWh/day for an ordinary household; large appliances like AC, water heater, washer add 15-20 kWh/day in summer, and 10-15 kWh/day in winter. Combined, most households use between 30-50 kWh per day on average.
Check How Much Sunlight Your Roof Receives
Once you know your electricity usage, the next step is to see "how much electricity can be generated." This depends on the solar irradiation conditions at the installation site, measured by "Peak Sun Hours" (PSH). It refers to the number of hours per day equivalent to 1000W/m². For example, Phoenix, Arizona has an average summer PSH of about 6.5 hours, while Boston, Massachusetts might only have 2.5 hours in winter.
Actual Generation Has Discounts
The module's rated power is its output under ideal conditions; the actual electricity reaching your home will be less. Main losses come from:
· Inverter Loss: Converting DC to AC electricity, efficiency is about 95%-98% (take 97% for mainstream inverters).
· Line Loss: Heat generation during transmission through wires, loss about 2%-3% (take 2% for short distances).
· Dust Shading: Efficiency decreases when modules are dusty; regular cleaning can control this to within 3% (take 3% if you're lazy).
· Temperature Loss: As mentioned earlier, power decreases by 0.3%-0.5% per C temperature increase, with an average annual impact of about 2% (take 2%).
Adding these up, total system efficiency ≈ 97% (inverter) × 98% (lines) × 97% (dust) × 98% (temperature) ≈ 90%. Actual generation will be about 10% less than the module's rated power.
How Much Total Power is Needed?
With the average daily electricity usage, local PSH, and system efficiency, you can calculate the required total module power (in kWp). The formula is:
Total Power (kWp) = Average Daily Electricity Usage (kWh) / (PSH × System Efficiency)
For example:
· Household average daily usage: 40 kWh (taking the high summer value)
· Local PSH = 5.5 hours (e.g., Austin, Texas, USA)
· System Efficiency = 90% (0.9)
Plug into the formula: Total Power = 40 / (5.5 × 0.9) ≈ 40 / 4.95 ≈ 8.08 kWp (i.e., 8080 Wp).
If choosing 540W modules, you would need 8080 ÷ 540 ≈ 15 pieces (15 × 540 = 8100 Wp, slightly exceeding the requirement, safer).
Accounting for Future Changes
Don't stop after the calculation; leave a margin. There are two reasons:
1. Increasing Electricity Demand: For example, buying an electric vehicle in two years might add 10 kWh/day for charging; or adding an electric heater could increase winter usage by 20%.
2. Module Degradation: Monocrystalline silicon modules degrade about 2% in the first year, and ≤0.4% annually thereafter. After 10 years, power remains at about 96% of initial, and after 25 years, about 88%.
It's recommended to add 10%-15% to the total power calculation. For example, the calculation above resulted in 8.08 kWp; adding a 10% margin gives 8.08 × 1.1 ≈ 8.89 kWp (8890 Wp). This would require 8890 ÷ 540 ≈ 16.5 pieces, so practically install 17 pieces (17 × 540 = 9180 Wp).
Roof Area is Also a Hard Limit
Even if the power calculation is correct, it's useless if the roof can't accommodate the modules. This is where "power density" comes in.
Different modules have different sizes:
· 540W module (182mm wafer): Size approx. 2278mm × 1134mm, area ≈ 2.58 m², power density ≈ 540 ÷ 2.58 ≈ 210 W/m².
· 670W module (210mm wafer): Size approx. 2384mm × 1303mm, area ≈ 3.11 m², power density ≈ 670 ÷ 3.11 ≈ 215 W/m².
For example, 17 pieces of 540W modules, with a spacing of 0.5 meters between each piece, total occupied area ≈ (2.58 + 0.5) × 17 ≈ 52 m² (accumulating spacing along the length). If the roof only has 40 m² available, you might need to switch to lower-power or more compact modules.
Factors Affecting Wattage
A solar module might be labeled with 22% efficiency, but actual performance can vary significantly. This isn't because the rating is deceptive, but because efficiency is influenced by several hidden parameters.
Cell Technology Route
The foundation of module efficiency is the underlying cell technology itself. Among current mainstream monocrystalline silicon cell technologies, efficiency differences can reach 3 percentage points.
· PERC (Passivated Emitter and Rear Cell): The most common, holding over 70% market share. It adds a passivation layer on the cell's rear side to reduce electron escape. Mass production efficiency is stable at 22-23% (e.g., LONGi's Hi-MO 5 series), with a lab limit around 24.5%. It's low cost and suitable for large-scale production, but efficiency is difficult to break through further.
· TOPCon (Tunnel Oxide Passivated Contact): The new mainstream generation. It creates a finer passivation structure on the rear side, resulting in less electron loss. Mass production efficiency is 24-25% (Jinko Tiger Neo series), with labs achieving 26.1% (data from Germany's Fraunhofer ISE). Its temperature coefficient is 0.05%/°C lower than PERC, maintaining efficiency more steadily under high temperatures.
· HJT (Heterojunction): A hybrid structure of amorphous silicon and crystalline silicon. The front side has no busbar shading, allowing more light absorption; the rear uses intrinsic amorphous silicon for passivation, reducing electron recombination. Mass production efficiency is 24-25% (Meyer Burger's SwissPERC HJT), with lab efficiency at 26.81% (Japan's Kaneka). It generates higher current under low light, producing more on cloudy days.
Which technology to choose? Depends on needs: choose PERC for cost-effectiveness, TOPCon for high-temperature performance, HJT for more generation days.
Temperature Coefficient
Modules aren't like refrigerators; they heat up when exposed to the sun. For every 1°C temperature increase, efficiency drops a bit; this drop rate is the temperature coefficient.
· Mainstream monocrystalline silicon modules have a temperature coefficient between -0.3% and -0.35%/°C. For example, a module with a -0.34%/°C coefficient will see efficiency drop by (50-25) × 0.34% = 8.5% when surface temperature rises from 25°C to 50°C (common in summer).
· High-quality modules can push the temperature coefficient down to -0.28%/°C (e.g., SunPower's Maxeon series). With the same temperature rise to 50°C, efficiency drops only (50-25) × 0.28% = 7% – don't underestimate this 1.5%; a 400W module could generate about 20 kWh more per year.
Users in southern regions should pay special attention: choose modules with a temperature coefficient ≤ -0.3%/°C, otherwise summer high temperatures could reduce annual generation by 3-5%.
Low-Light Performance
Efficiency isn't only relevant on sunny days. During dawn, dusk, or cloudy weather, when sunlight is weak (irradiance 200-500 W/m²), which module generates more?
· Test Standard: Use low irradiance conditions like AM1.5, 200 W/m² to measure the module's short-circuit current (Isc) and open-circuit voltage (Voc).
· Data Comparison: Under 200 W/m² irradiance, TOPCon cells have an Isc 8-10% higher than ordinary PERC; HJT is even higher, reaching 10-12% more. Converted to energy, this means an extra 0.5-1 hour equivalent generation on cloudy/rainy days (e.g., generating 2.5 kWh instead of 2 kWh).
· Practical Scenario: In Chengdu, which has 100 cloudy/rainy days per year on average, choosing HJT modules could yield 50-100 kWh more annually.
Long-Term Degradation
Efficiency isn't just about being high at purchase; it's about how long it "holds up." The degradation rate determines the actual generation capability after 25 years.
· First-Year Degradation: After installation, new modules may experience an initial efficiency drop in the first 3 months due to Light-Induced Degradation (LID). High-quality monocrystalline silicon degrades ≤2% in the first year (e.g., REC's Alpha Pure-R series), while ordinary modules might reach 3-4%.
· Annual Degradation: Afterwards, efficiency slowly decreases annually due to material aging (e.g., EVA encapsulant yellowing, silver paste oxidation). Mainstream products degrade ≤0.4% annually, retaining ≥80% of initial efficiency after 25 years (verified by IEC 61215-2016 damp heat test).
· Gap Example: Take two 400W modules. Module A has first-year degradation of 2%, annual degradation 0.4%. Module B has first-year degradation of 4%, annual degradation 0.6%. After 25 years, Module A power ≈ 400 × (1-2%) × (1-0.4%×24) = 400 × 0.98 × 0.904 ≈ 355W; Module B ≈ 400 × 0.96 × 0.876 ≈ 335W – generating 20 kWh less per year, a difference of 500 kWh over 25 years.
Rear Side Reflectivity
The back of a monocrystalline silicon module isn't empty; the backing material can reflect light, allowing the cell to absorb sunlight from both front and rear.
· Ordinary back sheets have a reflectivity of about 70%, reflecting 10-15% of ground-reflected light back to the cells.
· High-reflectivity back sheets (e.g., white EVA or glass back sheets) can increase reflectivity to over 85%. Tests show that modules with high-reflectivity back sheets absorb 5-8% more light from the rear, increasing overall efficiency by 0.5-1%.
Roof color also has an impact: installed on a white roof, modules with high-reflectivity back sheets can generate 2-3% more; the effect is less noticeable on dark-colored roofs.
Efficiency
Mainstream monocrystalline silicon solar module efficiency has reached 22-24% (PERC technology), an increase of nearly 8 percentage points compared to a decade ago – resulting in approximately 300-500 kWh more annual energy generation for a 10kW system.
TOPCon mass production efficiency is 24-25%, with lab breakthroughs reaching 26%; HJT is stable at 24-25%, with superior low-temperature performance.
What is Solar Module Efficiency?
You might have heard "this solar panel has 22% efficiency," but what exactly does efficiency mean? It's not simply "how much electricity it generates," but rather the proportion of sunlight energy converted into usable electrical energy.
How is the sunlight-to-electricity conversion ratio calculated?
Solar module efficiency is essentially an "input-output" energy calculation. The internationally recognized Standard Test Conditions (STC) serve as the benchmark:
l Irradiance: 1000W/m² (Equivalent to direct noon sunlight, energy density roughly equal to 1000 watts of power falling per second on a one-square-meter surface);
l Temperature: 25°C (Reference temperature for module operation; actual operating temperature increases due to heat absorption);
l Spectrum: AM1.5 (Air Mass 1.5, simulating the solar spectrum at noon in mid-latitude regions).
Under these conditions, the module's output DC power (in Watts, W) divided by the total solar energy it receives (1000W/m² × module area), multiplied by 100%, gives the efficiency percentage.
For a concrete example: A common monocrystalline silicon module, rated at 400W, with an area of 1.7 m². The total solar energy it receives is 1000W/m² × 1.7 m² = 1700W. The efficiency is 400W ÷ 1700W ≈ 23.5% (In reality, factors like glass transmittance loss are deducted, resulting in a labeled efficiency of about 24%).
Why can't solar panels achieve 100% efficiency?
One might ask: "Since sunlight energy is abundant, why can't efficiency be higher?" This involves limitations set by physical laws. In 1961, scientists proposed the Shockley-Queisser Limit, indicating the theoretical maximum efficiency for a single-junction solar cell is approximately 33%.
Why is it capped at this value? Because sunlight contains photons of different energies:
l Low-energy photons (e.g., infrared light) cannot excite electrons and pass directly through the cell;
l High-energy photons (e.g., ultraviolet light) excite electrons with excess energy, which is wasted as heat;
l Even excited electrons can "recombine" (re-form into neutral particles) due to material defects, resulting in current loss.
Monocrystalline silicon can approach this limit precisely because of its more perfect crystal structure. Compared to early multicrystalline silicon (efficiency 15-17%), monocrystalline silicon reduces grain boundary defects, converting more photons into effective current.
What factors steal energy?
In practice, efficiency is reduced by various factors. Understanding these "opponents" helps you view labeled values more objectively:
l Temperature Effect: Modules heat up during operation. For every 1°C temperature increase, efficiency decreases by about 0.3-0.5% (temperature coefficient). A module operating at 70°C will have an efficiency (70-25)×0.4%≈18% lower than at 25°C.
l Spectral Deviation: On cloudy days or at high altitudes, the solar spectrum deviates from AM1.5, making some wavelengths of light less effectively utilized. TOPCon modules, due to better passivation technology, adapt to spectral changes 5-8% better than PERC.
l Long-term Degradation: UV exposure causes encapsulant materials (like EVA film) to yellow, gradually blocking light. High-quality modules lose about 20% efficiency over 25 years due to aging (first-year degradation ≤2%, subsequent annual degradation ≤0.4%).
The Practical Significance of Efficiency
Efficiency isn't an abstract percentage; it directly determines how much electricity you can use. Compare two modules:
l A: 400W, area 1.7 m², efficiency 24%;
l B: 400W, area 1.9 m², efficiency 21%.
Installed on the same roof, Module A has higher power per unit area (235W/m² vs. 210W/m²). If the roof has only 10 m² available, you could fit about 42 of Module A (total power 16.8kW), but only about 52 of Module B (total power 20.8kW) – however, if the roof is only 8 m², you could fit about 47 of Module A (18.8kW), but Module B wouldn't fit (requiring 8.8 m² × 52 ≈ 46 m², clearly exceeding the area).
Measuring Efficiency
Your purchased module is labeled 22% efficiency – how do you know if it's accurate? The international standard IEC 61215 specifies a strict testing process:
1. Simulate 1000W/m² irradiance, measure maximum output power (Pmax);
2. Calculate efficiency: Pmax ÷ (Irradiance × Module Area × Transmittance Correction);
3. Additional tests: Performance under low irradiance (200 W/m²), high temperature (75°C), low temperature (-40°C) to ensure data validity beyond "ideal conditions".
Why Does Monocrystalline Silicon Lead in Efficiency?
Crystal Structure
The term "monocrystalline" in monocrystalline silicon refers to its highly ordered internal atomic arrangement – like a complete cube built with Lego bricks, all atoms arranged regularly in the same direction.
Specifically:
l Monocrystalline silicon has an extremely low dislocation density (atomic misalignment defects in the crystal), typically less than 1000 per square centimeter; multicrystalline silicon, formed by random joining of small crystal grains, has a dislocation density as high as 10^6 per square centimeter or more.
l Where dislocations are high, electrons are easily "trapped" or recombine with other particles (re-forming into neutral atoms), leading to current loss. The minority carrier lifetime (the time an electron survives and moves) in monocrystalline silicon can exceed 100 microseconds, while multicrystalline silicon is only 20-30 microseconds – the longer the lifetime, the more electrons reach the cell's electrodes, naturally resulting in higher efficiency.
For example: When 1000 photons excite electrons, monocrystalline silicon can collect 850 electrons to form current, while multicrystalline silicon collects only 700.
Manufacturing Process
Monocrystalline silicon's production processes (Czochralski / CZ method and Float Zone / FZ method) reduce defects from the source.
l Czochralski Method: Silicon feedstock is melted, then a seed crystal is slowly pulled to grow a cylindrical ingot over 300mm in diameter. During this process, crystal growth speed is controllable (1-2mm/minute), impurities (like oxygen, carbon) are evenly distributed, and grain boundaries are minimal.
l Multicrystalline Silicon Casting: Silicon feedstock is melted and then directly cooled and solidified, forming random crystal grains. Grain boundaries are distributed throughout the crystal like "cracks." These boundaries not only trap electrons but also reflect some light, reducing absorption.
Data comparison: Monocrystalline silicon modules have light reflection loss of about 8-10% (can be reduced to 5% with anti-reflection coating optimization), while multicrystalline silicon, due to grain boundary scattering, has reflection loss of 12-15%. In other words, monocrystalline silicon can absorb 3-5% more solar energy.
High-Efficiency Routes Prefer Monocrystalline Silicon
Breakthroughs in solar technology are almost always first implemented on monocrystalline silicon. This isn't manufacturer bias; it's because monocrystalline silicon's material properties are better suited for accommodating new technologies.
l PERC Technology (Passivated Emitter and Rear Cell): Adds a passivation layer on the cell's rear side to reduce electron recombination. Monocrystalline silicon's surface is flatter, allowing tighter bonding of the passivation layer to silicon. Mass production efficiency is 2-3 percentage points higher than multicrystalline PERC (monocrystalline PERC reaches 22-23%, multicrystalline PERC only 19-21%).
l TOPCon Technology (Tunnel Oxide Passivated Contact): Requires an ultra-thin, high-quality oxide layer (1-2 nm) and a doped layer. Monocrystalline silicon has fewer surface defects, leading to a more uniform oxide layer. Lab efficiency has exceeded 26%; multicrystalline silicon, due to grain boundary interference, struggles to stably achieve efficiency above 25%.
l HJT Technology (Heterojunction): Deposits an amorphous silicon film on the monocrystalline silicon surface, forming a "crystalline silicon + amorphous silicon" structure. Monocrystalline silicon's high minority carrier lifetime allows better utilization of amorphous silicon's passivation effect. Mass production efficiency is stable at 24-25%, with low-light performance over 10% better than multicrystalline silicon.
Material Purity
Monocrystalline silicon purity typically reaches 99.9999% (6N) or higher, while multicrystalline silicon is slightly lower (some products 5N-6N).
l Impurities (like iron, copper ions) "trap" electrons, shortening carrier lifetime. Due to more controllable growth processes, monocrystalline silicon has an impurity concentration one order of magnitude lower than multicrystalline silicon (10^15 atoms/cm³ vs. 10^16 atoms/cm³).
l Monocrystalline silicon with fewer impurities has lower resistivity. For wafers of the same thickness, monocrystalline silicon's series resistance is 10-15% lower than multicrystalline silicon, resulting in smaller current transmission losses.
Thinning
Monocrystalline silicon's mechanical strength and crystal integrity allow it to be made thinner without cracking. Current mainstream monocrystalline silicon wafers are 150-170 microns thick, while multicrystalline silicon wafers are mostly 180-200 microns.
l Thinner wafers reduce the material's own absorption of light (silicon strongly absorbs infrared light), allowing more light to penetrate to the cell's active layer.
l Thinner wafers shorten the distance electrons travel from the back to the front, reducing recombination probability. Tests show that reducing monocrystalline silicon wafer thickness from 180 microns to 150 microns can increase efficiency by 0.3-0.5%.
What Affects Efficiency?
A solar module is labeled 22% efficiency, but actual performance can vary significantly. This isn't because the labeled value is deceptive, but because efficiency is influenced by several hidden parameters.
Different Technologies Have Different Efficiency Limits
The foundation of module efficiency is the cell's underlying technology route. Among current mainstream monocrystalline silicon cell technologies, efficiency differences can reach 3 percentage points.
l PERC (Passivated Emitter and Rear Cell): The most common, holding over 70% market share. Adds a passivation layer on the cell's rear side to reduce electron escape. Mass production efficiency is stable at 22-23% (e.g., LONGi's Hi-MO 5 series), with a lab limit around 24.5%.
l TOPCon (Tunnel Oxide Passivated Contact): The new mainstream generation. Creates a finer passivation structure on the rear side, resulting in less electron loss. Mass production efficiency is 24-25% (Jinko Tiger Neo series), with labs achieving 26.1% (data from Germany's Fraunhofer ISE). Its temperature coefficient is 0.05%/°C lower than PERC, maintaining efficiency more steadily under high temperatures.
l HJT (Heterojunction): A hybrid structure of amorphous silicon and crystalline silicon. The front side has no busbar shading, allowing more light absorption; the rear uses intrinsic amorphous silicon for passivation, reducing electron recombination. Mass production efficiency is 24-25% (Meyer Burger's SwissPERC HJT), with lab efficiency at 26.81% (Japan's Kaneka).
Which technology to choose? Depends on needs: choose PERC for cost-effectiveness, TOPCon for high-temperature performance, HJT for more generation days.
Temperature Coefficient
Modules aren't like refrigerators; they heat up when exposed to the sun. For every 1°C temperature increase, efficiency drops a bit; this drop rate is the temperature coefficient.
l Mainstream monocrystalline silicon modules have a temperature coefficient between -0.3% and -0.35%/°C. For example, a module with a -0.34%/°C coefficient will see efficiency drop by (50-25) × 0.34% = 8.5% when surface temperature rises from 25°C to 50°C (common in summer).
l High-quality modules can push the temperature coefficient down to -0.28%/°C (e.g., SunPower's Maxeon series). With the same temperature rise to 50°C, efficiency drops only (50-25) × 0.28% = 7% – don't underestimate this 1.5%; a 400W module could generate about 20 kWh more per year.
Users in southern regions should pay special attention: choose modules with a temperature coefficient ≤ -0.3%/°C, otherwise summer high temperatures could reduce annual generation by 3-5%.
Low-Light Performance
Efficiency isn't only relevant on sunny days. During dawn, dusk, or cloudy weather, when sunlight is weak (irradiance 200-500 W/m²), which module generates more?
l Test Standard: Use low irradiance conditions like AM1.5, 200 W/m² to measure the module's short-circuit current (Isc) and open-circuit voltage (Voc).
l Data Comparison: Under 200 W/m² irradiance, TOPCon cells have an Isc 8-10% higher than ordinary PERC; HJT is even higher, reaching 10-12% more. Converted to energy, this means an extra 0.5-1 hour equivalent generation on cloudy/rainy days (e.g., generating 2.5 kWh instead of 2 kWh).
l Practical Scenario: In Chengdu, which has 100 cloudy/rainy days per year on average, choosing HJT modules could yield 50-100 kWh more annually.
Long-Term Degradation
Efficiency isn't just about being high at purchase; it's about how long it "holds up." The degradation rate determines the actual generation capability after 25 years.
l First-Year Degradation: After installation, new modules may experience an initial efficiency drop in the first 3 months due to Light-Induced Degradation (LID). High-quality monocrystalline silicon degrades ≤2% in the first year (e.g., REC's Alpha Pure-R series), while ordinary modules might reach 3-4%.
l Annual Degradation: Afterwards, efficiency slowly decreases annually due to material aging (e.g., EVA encapsulant yellowing, silver paste oxidation). Mainstream products degrade ≤0.4% annually, retaining ≥80% of initial efficiency after 25 years (verified by IEC 61215-2016 damp heat test).
l Gap Example: Take two 400W modules. Module A has first-year degradation of 2%, annual degradation 0.4%. Module B has first-year degradation of 4%, annual degradation 0.6%. After 25 years, Module A power ≈ 400 × (1-2%) × (1-0.4%×24) = 400 × 0.98 × 0.904 ≈ 355W; Module B ≈ 400 × 0.96 × 0.876 ≈ 335W – generating 20 kWh less per year, a difference of 500 kWh over 25 years.
Rear Side Reflectivity
The back of a monocrystalline silicon module isn't empty; the backing material can reflect light, allowing the cell to absorb sunlight from both front and rear.
l Ordinary back sheets have a reflectivity of about 70%, reflecting 10-15% of ground-reflected light back to the cells.
l High-reflectivity back sheets (e.g., white EVA or glass back sheets) can increase reflectivity to over 85%. Tests show that modules with high-reflectivity back sheets absorb 5-8% more light from the rear, increasing overall efficiency by 0.5-1%.
Roof color also has an impact: installed on a white roof, modules with high-reflectivity back sheets can generate 2-3% more; the effect is less noticeable on dark-colored roofs.
Durability
Two 400W modules with first-year degradation of 1.5% (POE encapsulation) and 2.5% (traditional EVA) respectively will have powers of 328W and 280W after 25 years, resulting in a cumulative energy generation difference of 32,000 kWh (calculated based on annual irradiation of 1200 kWh/m²).
73% of power plant operation and maintenance reports indicate that exceeding degradation standards is the main cause of later-stage costs. Choosing durable modules can reduce hidden expenses by over 30%.
Material System
Encapsulant Film
The two mainstream encapsulant films on the market are – EVA (Ethylene-Vinyl Acetate copolymer) and POE (Polyolefin Elastomer).
EVA is low cost, priced 30%-40% cheaper per square meter than POE. However, its molecular chain contains acetate groups, which are prone to hydrolysis when encountering moisture, producing acetic acid that corrodes the cell's silver grid lines. Lab data: After 1000 hours of damp heat testing (85°C/85% relative humidity), the volume resistivity of EVA encapsulant drops from an initial 10¹⁴ Ω·cm to 10¹⁰ Ω·cm, its conductivity increases ten-thousand-fold, drastically increasing the risk of PID (Potential Induced Degradation). POE's molecular chain lacks polar groups, its hydrolysis rate is 90% lower, and its volume resistivity only drops to 10¹³ Ω·cm during the same period, controlling PID degradation to <1.5% in the first year (IEC TS 62804 standard).
New encapsulant films both have around 92% light transmittance initially, but aging reveals differences: After 1000 hours of UV aging (150 W/m² UV irradiation), EVA's yellowing index ΔYI (a measure of color change) reaches 8-10, and transmittance decreases by 3-4%; POE's ΔYI is only 2-3, and transmittance remains above 90%.
Backsheet
The backsheet is attached to the rear of the module, tasked with waterproofing, UV resistance, and acid/alkali resistance. About 90% of market back sheets have a three-layer composite structure: outer fluoropolymer layer (PVF or PVDF), middle PET (Polyester), inner fluoropolymer coating.
PVF (Polyvinyl fluoride) has a high fluorine-carbon bond energy of 485 kJ/mol, much stronger than PET's C-C bond (347 kJ/mol). Tests show: After 1000 hours of UV aging, PVF's outer layer retains >80% elongation at break (still stretchable), while a pure PET backsheet's elongation at break is only 50% (approaching brittleness). The more expensive PVDF (Polyvinylidene fluoride) performs slightly better but costs 15% more.
The thickness of the middle PET layer also affects lifespan. Mainstream back sheets have a 25μm thick PET layer; high-end versions use 30μm. Accelerated aging tests (85°C/85%RH) show: 25μm PET has a water absorption rate of 0.5% after 5000 hours (IEC requires <1%), while 30μm PET has only 0.3% water absorption, and water vapor transmission rate decreases from 0.2 g/(m²·day) to 0.15 g/(m²·day). This is crucial for modules in high-humidity regions – 10% less moisture penetration slows cell oxidation by 20%.
Glass
The front of the module is a piece of low-iron tempered glass, commonly 3.2mm or 2.0mm thick. The advantage of 3.2mm glass lies not in light transmittance (both are >91%), but in impact resistance and waterproofing.
Impact resistance test per IEC 61215 standard: A 25mm diameter hailstone impacts at 23 m/s (83 km/h). 2.0mm glass has a breakage rate >15%, while 3.2mm glass has almost zero breakage. Waterproofing relies on the adhesive strength between the glass and encapsulant. 3.2mm glass undergoes "chemical tempering" treatment, achieving a peel strength with EVA/POE of >30 N/cm (2.0mm glass is only 25 N/cm).
Frame
The frame is the module's "metal skeleton," 95% are made of aluminum alloy. The key lies in the surface treatment process.
The industry standard film thickness is ≥15μm; high-quality frames achieve 20μm. In salt spray tests (ASTM B117): A frame with 15μm film thickness shows white rust (corrosion product) after 500 hours; a 20μm frame only shows it after 1000 hours.
The common frame width is 35mm; frames thickened to 40mm increase snow load resistance from 4200 Pa (4.3 meters snow equivalent) to 5400 Pa (5.5 meters snow equivalent). This is practical in snowy regions – every 1000 Pa increase in snow pressure raises the risk of frame deformation by 15%, potentially causing glass cracking.
The "1+1>2" Effect of Material Combination
For example, the "Dual-glass + POE + Fluoropolymer back sheet" solution: Dual-glass (2.0mm+2.0mm) has almost zero water vapor transmission, POE encapsulant resists PID, fluoropolymer back sheet resists UV. Combined, these result in <3% power degradation after 1000 hours of damp heat aging (industry average is 5%).
Another example: "Single-glass + POE + 3.2mm glass": Replacing EVA with POE reduces first-year PID degradation from 3% to 1.5%. Combined with the low peel strength loss of 3.2mm glass, the power retention rate after 25 years can be 5% higher.
Production Process
A module goes through over 20 processes from wafer to finished product. Precision deviations at each step can become failure points a decade later. Machine parameters, operator habits, even ambient temperature and humidity in the factory can subtly affect the module's aging resistance.
Cell Soldering
Cells need to be connected into a circuit using solder ribbons. Traditional processes use infrared soldering, where temperature control relies on experience; now mainstream methods have shifted to laser soldering, but incorrect parameters can still cause issues.
Temperature fluctuations of ±10°C are common in infrared soldering. High temperatures can soften and deform the cell's main grid lines (silver-coated strips); upon cooling, contraction causes pulling, creating micro cracks invisible to the naked eye. Lab simulations: Modules with infrared soldering show micro crack rate increasing from an initial 0.2% to 1.8% after 5 years of operation, corresponding to an additional 0.7% power degradation.
Laser soldering uses pulsed light spots, with temperature precision within ±2°C. Tests show: Laser-soldered cells maintain a micro crack rate <0.05% throughout, resulting in 0.5% lower power degradation after 25 years compared to infrared soldering.
Layup and Cutting
Layup involves stacking glass, encapsulant, cells, and back sheet in order, preparing for lamination. Dimensional accuracy during cutting directly affects later moisture penetration.
The industry standard cutting accuracy is ±1mm, but leading manufacturers can achieve ±0.5mm. Don't underestimate this 0.5mm: If the encapsulant is 1mm larger than the glass during layup, lamination can cause edge folds, creating tiny gaps. After 3 years of operation, moisture seeping in from these gaps accelerates edge oxidation of the cells by 15%.
During layup, a 1.5mm gap between cells is maintained for heat dissipation, but manual operation might squeeze it to 1mm. Insufficient spacing causes uneven EVA flow and filling during lamination, locally generating bubbles. Moisture content in bubbled areas is 5 times that of normal areas. After 5 years, delamination starts here, and power degradation is 2% faster than other areas.
Lamination and Curing
The laminator is the key equipment that presses all layers into a whole. More precise temperature control results in more uniform cross-linking degree (similar to "curing degree") of the EVA encapsulant.
The industry standard lamination temperature tolerance is ±2°C, but high-quality production lines can achieve ±1°C. Tests show: In production lines with large temperature fluctuations, the EVA cross-linking degree at the module edges might be only 75% (standard ≥80%), while the center reaches 88%. Areas with low cross-linking are prone to later delamination – after 10 years of operation, delaminated area might expand from 0.1% to 5%, corresponding to an additional 2% power degradation.
Lamination time also matters. EVA requires 12 minutes for complete cross-linking, but some factories compress it to 10 minutes to increase output. Short-term, it seems fine, but after long-term aging, incompletely cross-linked EVA slowly decomposes, releasing acetic acid gas that corrodes the cells. Modules laminated for 10 minutes degrade 1.2% faster after 8 years compared to those laminated for 12 minutes.
Edge Sealing
After lamination, a bead of butyl sealant is applied around the module edges to prevent moisture ingress from the sides.
The industry standard requires continuous butyl sealant without breaks. However, in actual production, excessive machine speed can cause 0.5mm gaps in the sealant bead. Initially covered by the adhesive layer, these gaps become invisible. After 3 years of operation, moisture seeping in from these gaps forms condensation inside. Tests show: Modules with gaps have 3% more degradation at the edge cells after 10 years compared to gap-free modules, with some even developing micro cracks locally.
The thickness of the butyl sealant also matters. Too thin (<0.5mm) is prone to cracking; too thick (>1.0mm) increases module weight. High-quality production lines control it at 0.7-0.8mm, ensuring sealing while avoiding stress concentration. Data from one manufacturer: Modules with continuous, gap-free butyl sealant have <2% edge delamination after 25 years, far lower than the 15% seen in modules with gaps.
Environmental Adaptability
Damp Heat Test
Southern regions with plum rain season + summer heat expose modules to months of high humidity and temperature. Labs simulate this using the IEC 61215 damp heat test: 85°C temperature + 85% relative humidity, sustained for 1000 hours (approx. 41 days).
What happens to ordinary modules during this period? EVA encapsulant absorbs water and expands, reducing its adhesion to glass; the PET layer in the back sheet softens after water absorption, reducing tear resistance. Test data: Industry average power degradation after 1000 hours is 8%-10%, with poorer ones possibly reaching 15%.
How do high-quality modules handle it? Use POE encapsulant + Fluoropolymer back sheet. POE's water absorption rate is only 1/5 that of EVA (0.1% vs. 0.5%); fluoropolymer's fluorine-carbon bonds are more stable under high humidity. Actual measurements: Modules using POE + Fluoropolymer back sheet show <5% degradation after 1000 hours damp heat, with some manufacturers achieving <3%. Data from an overseas power plant: Out of 100 modules installed, those using ordinary materials had a 3 times higher repair rate after 5 years due to edge delamination causing short circuits.
High Cold Test
Northern winters subject modules to repeated cycles of daytime snowmelt (above 0°C) and nighttime freezing (below -20°C). Even harsher is the IEC's "Thermal Cycling Test": Freeze at -40°C for 1 hour, then move to a 25°C environment to thaw for 1 hour, repeated 50 times.
Low temperatures make materials brittle. Ordinary EVA encapsulant at -40°C has an elongation at break of only 10% (compared to 500% at room temperature), risking cracking under slight stress. Tests show: Non-optimized modules see a 2%-3% increase in micro crack rate after 50 cycles, with an additional 1% power degradation.
POE encapsulant with added toughening agents can maintain an elongation at break over 30% at -40°C. One brand conducted an extreme test: freezing modules at -40°C for 72 hours. After removal, the frame was bent immediately; the glass didn't break, and the encapsulant didn't crack. In practical operation, such modules used in Mohe, Northeast China for 8 years showed no large-area micro cracks.
Mechanical Load
Strong winds during typhoons and winter snow apply vertical pressure on modules. The IEC standard requires modules to withstand 5400 Pa (approx. 5.5 meters snow load or 130 km/h wind speed), but actual extreme weather can be higher.
Tests use a machine to press on the module, simulating snow or wind load. What happens with inferior materials? Frame deformation, glass cracking, internal cell microcracking. Data shows: Aluminum alloy frame with 15μm film thickness deforms 0.3mm under 5400 Pa pressure; with 20μm film thickness, deformation is only 0.1mm. Larger deformation causes gaps between the glass and frame, allowing wind and moisture ingress.
2.0mm glass has a 12% breakage rate under 5400 Pa, while 3.2mm glass has almost 0% breakage. A comparison from a European wind farm: Modules with 3.2mm glass had a cumulative damage rate of 0.5% over 10 years due to hail/strong winds; those with 2.0mm glass had a 3% damage rate, with maintenance costs 2 times higher.
Salt Spray Test
High salt spray concentration near the coast can easily corrode module frames and back sheets. The ASTM B117 salt spray test immerses modules in a 5% sodium chloride solution, spraying continuously for 1000 hours.
Ordinary aluminum alloy frames with 15μm film thickness develop white rust (aluminum oxide) on the surface after 1000 hours, with a corrosion depth of 20μm; frames with 20μm film thickness have half the white rust, with corrosion depth <10μm. If the back sheet is ordinary PET, it will absorb moisture and swell under salt spray, leading to delamination.
High-end modules use dual-glass + fluoropolymer backsheet + thickened frame. Dual-glass itself is corrosion-resistant, the fluoropolymer backsheet doesn't absorb moisture, and the frame has 20μm film thickness. Tests show: This combination results in frame corrosion depth <5μm and no backsheet delamination after 1000 hours salt spray. A fishery-solar complementary power station in Hainan used this for 5 years; the modules' appearance remained largely unchanged, with annual power degradation <0.4%.
Check if they've been through the 85°C/85% humidity "sauna," endured the -40°C "freezer," withstood the 5400 Pa "pressure test," and survived the salt spray "swimming pool."