How to Optimize Monocrystalline Solar Panel Output: 6 Techniques
Monthly cleaning (lifts yield 5-8%), tilt to latitude ±5° for max sun, use MPPT inverters (>98% efficiency), ensure airflow to limit cell temp <45°C (cuts thermal loss), avoid shading (prevents 10% hotspot damage), and quarterly IV tests to catch degradation early.
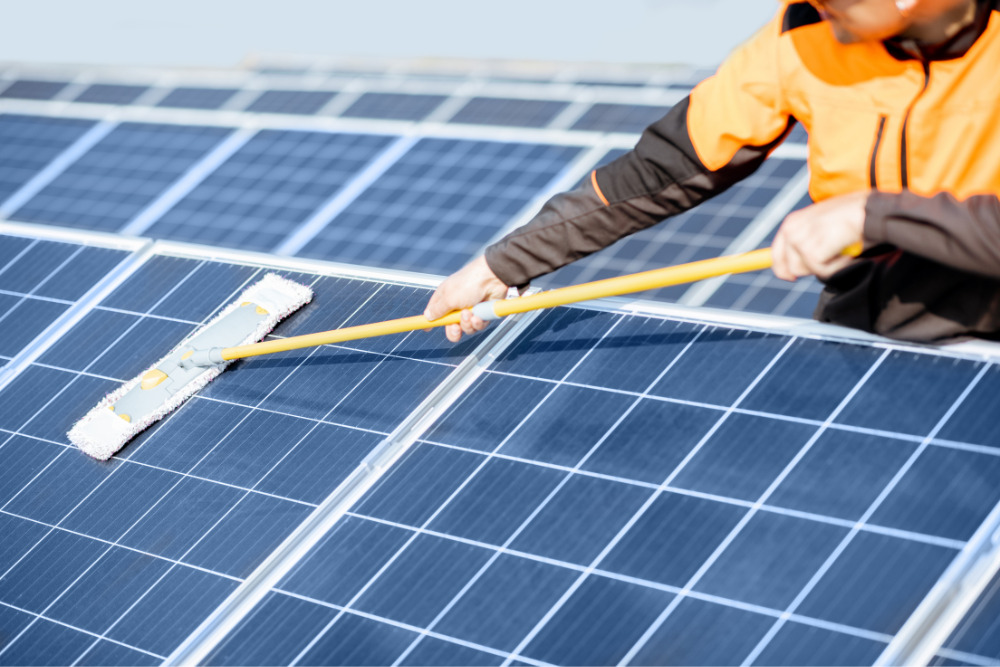
Clean Panels Regularly
The technical term for this accumulation—can easily cause performance losses of 5% or more annually. In arid, dusty environments or areas with heavy bird traffic, these losses can skyrocket to 15-25% per year, effectively negating the financial returns of a significant portion of your system's output. For a typical 6-kilowatt residential system, a 15% loss translates to nearly 1,000 kilowatt-hours of unused electricity annually, enough to power a highly efficient refrigerator for an entire year.
A home in a suburban area with regular rain might only need a thorough cleaning once every 12 months. In contrast, a property near farmland, a busy road, or a coastal area with salty air might require cleaning every 3 to 6 months.
The single most important safety rule is to clean panels early in the morning or on an overcast day. Cleaning hot panels with cold water risks thermal shock, which can crack the tempered glass. Furthermore, the system will be producing little to no power, making the task much safer.
Professional cleaning services typically charge 150 to 300 for an average-sized residential array. Weigh this against the value of the recaptured energy. If your system loses 10% of its 10,000 kWh annual production, that's 1,000 kWh lost. At a utility rate of 0.15per k Wh ,that′s 150 of electricity wasted every year. In this scenario, a single $200 professional cleaning that restores most of that loss pays for itself in a little over a year.
Adjust the Panel Tilt Angle
In fact, a panel fixed at a suboptimal tilt angle can forfeit between 5% and 15% of its potential annual energy production compared to an ideally adjusted one. This isn't a small margin; for a system generating 1,500 worth of electricity annually,a10150 left on the table every year.
Your Location's Latitude | Recommended Spring/Autumn Tilt | Recommended Summer Tilt (Latitude -15°) | Recommended Winter Tilt (Latitude +15°) | Estimated Annual Efficiency Gain vs. Fixed Angle |
30° (e.g., Houston, TX) | 30° | 15° | 45° | 5% - 7% |
40° (e.g., New York, NY) | 40° | 25° | 55° | 6% - 8% |
50° (e.g., Calgary, Canada) | 50° | 35° | 65° | 7% - 10% |
For ground-mounted arrays, even two manual adjustments per year—one in the spring and one in the autumn—can recover the majority of this lost energy, typically around 5-6% annually. A spring adjustment around March 21st (Vernal Equinox) sets the panels for the high-sun months, while an autumn adjustment around September 21st (Autumnal Equinox) optimizes them for the winter sun. The most significant gains are seen in the winter adjustment. Increasing the tilt angle to latitude + 15° helps the panels "look" higher in the sky, capturing more of the scarce winter sunlight and significantly reducing snow accumulation, as the steeper angle encourages snow to slide off.
For roof-mounted systems, adjusting the tilt is often impractical. In this case, the best practice is to set a fixed, compromise angle. Installing panels at an angle equal to your latitude is a good rule of thumb for maximizing annual production. If your energy usage is higher in summer (e.g., for air conditioning), an angle of latitude minus 10-15° will bias production toward those months. The cost of a professional adjustment for a ground-mounted system might range from 150to400, but the annual energy gain of 6% on a 10 kW system could be over 600 kWh, providing a return on investment in just 1-2 years depending on local electricity rates. For the DIY enthusiast, a simple angle finder tool costing less than $20 is all that's needed to make precise adjustments, making this one of the highest-return, lowest-cost optimizations available.
Choose a Sunny, Unshaded Location
Industry testing shows that shade covering as little as 10% of a string inverter system can cause a power loss of 50% or more. For a homeowner, this means a shadow from a single chimney or a thin tree branch during key sunlight hours can slash the expected financial returns of a $20,000 system by hundreds of dollars per year.
The first step is a meticulous site assessment, focusing on the solar window from 9:00 AM to 3:00 PM solar time, which captures the most intense radiation. The goal is to achieve an absolute minimum of 5 hours of uninterrupted direct sunlight, with 6-7 hours being the ideal target for most climates. Potential obstructions must be evaluated not just for their current height, but for their future growth over the system's 25 to 30-year lifespan. A sapling planted 10 feet south of the array could be a 20-foot tall problem in 8 years. The cost of a professional shading analysis using a tool like a Solmetric SunEye typically ranges from 150 to 400, but it provides a precise, data-driven forecast of production losses.
Obstruction Type | Estimated Annual Production Loss (for a standard string inverter system) | Mitigation Strategy & Cost Impact |
Thin Branch (covering 5% of 1 panel) | 15% - 30% | Trim branch (Low Cost). Cost: 0−150. ROI: Immediate. |
Chimney/Vent Pipe (casting shadow on 2 panels for 3 hrs/day) | 8% - 12% | Reposition array if possible (Medium Cost). Cost: Varies. Alternative: Use optimizers. |
Deciduous Tree (winter sun ok, summer shade) | 10% - 25% (seasonal) | Tree trimming or removal (High Cost). Cost: 500−2,500. Requires careful ROI calculation. |
Neighboring Building (permanent afternoon shade) | 30% - 60% | Often a site killer. Consider a different roof plane or ground mount. May not be feasible. |
The standard string inverter is the most cost-effective solution for completely unshaded sites, with an average cost of 0.10 to 0.20 per watt. However, for sites with minor, unpredictable, or complex shading, investing in module-level power electronics (MLPE) like power optimizers or microinverters is financially justified. These devices, which add 0.15to0.35 per watt to the system's total cost, allow each panel to operate independently. If one panel is shaded, the others continue at 98-99% of their peak capacity. In a scenario with 15% shading loss on a string system, MLPE can recapture up to 12% of that lost energy, boosting the system's overall annual output significantly. This can translate to an additional 180o fel ectricity per year on a 1,500 annual production system, paying back the 1,500 to 2,000 premium for the MLPE technology in roughly 8 to 11 years.
Use Compatible System Modules
System losses from incompatibility or poor design can silently erode 5% to 15% of your system's expected output before the energy even reaches your home. This "hidden tax" on performance directly extends the payback period of your investment. For instance, a 7% loss on a 10 kW system translates to over 700 kWh of unused electricity annually, which at a rate of 0.15 perkWh is 105 lost every year.
The inverter's Maximum DC Input Voltage—often around 600V for residential string inverters—must never be exceeded by the combined open-circuit voltage (Voc) of the panel string, especially in cold weather, as panel voltage increases by approximately 0.3% per degree Celsius below the standard test condition of 25°C. Conversely, the inverter's MPPT (Maximum Power Point Tracking) voltage window, typically a range like 250V to 550V, is where the inverter operates most efficiently. If the panels' operating voltage consistently falls outside this window, efficiency can plummet from 97% to below 90%.
Beyond the panel-inverter handshake, other modules play a vital role in minimizing losses:
l DC/AC Ratio (Inverter Loading Ratio): It's standard and often beneficial to slightly "oversize" the solar array relative to the inverter's rated power. A DC/AC ratio of 1.2 to 1.3 is common. This means for a 7.6 kW AC inverter, you might install up to 9.1 kW DC of panels (7.6 kW x 1.2). This costs relatively little extra but captures significantly more energy during non-peak hours (early morning, late afternoon, cloudy days), increasing annual production by 3% to 6% without overloading the inverter during perfect midday conditions.
l Wire Sizing: Using undersized cables for the run between the panels and inverter creates resistive losses, wasting power as heat. For a 30-foot run with a 20-amp current, upgrading from 10-gauge to 8-gauge wire (at a cost increase of about $0.50 per foot) can reduce voltage drop from 2.5% to about 1.5%, reclaiming 1% of your system's power that would have been lost. Over 20 years, that saved energy far outweighs the marginal upfront cost.
l Monitoring Integration: A compatible monitoring system is non-negotiable for proactive maintenance. A good system will provide panel-level or string-level data, alerting you to a 15% drop in one string's output that could indicate a fault, allowing for a repair that might save $200 in lost production over several months.
Paying a 5% to 10% premium for a fully integrated and optimally sized system from a single manufacturer or a knowledgeable installer often results in a 5% to 8% higher annual energy yield. This boosts the system's internal rate of return (IRR) and can shorten the payback period by 6 to 18 months. Furthermore, using compatible modules from a single vendor often simplifies the warranty process, potentially extending the inverter's warranty from 10 years to 25 years for a small additional fee, protecting your investment for the system's entire 25 to 30-year lifespan.
Check and Secure Wiring
A single loose connection on a DC string, with a resistance increase of just 0.5 ohms, can lead to a power loss of 2-5% for that entire circuit. Over a year, on a 10 kW system, that translates to 200-500 kWh of lost energy, worth approximately 30to75 at average electricity rates. More critically, the heat generated at that poor connection can reach temperatures exceeding 70°C (158°F), accelerating the degradation of surrounding materials and creating a significant fire risk over the system's 25-year lifespan.
A systematic approach to checking wiring should be performed once every 3 to 5 years by a qualified technician, with a visual inspection by the homeowner annually. The focus should be on the entire DC circuit, from the panels to the inverter. The primary points of failure are always at connection points. Using a thermal imaging camera during a system scan is the most effective method, as it can pinpoint a hot connection that might only be 10-15°C (18-27°F) warmer than the others, indicating a problem long before it causes a measurable drop in production on standard monitoring software. A professional thermal scan typically costs 150 to 300, but identifying a single faulty MC4 connector can prevent the loss of hundreds of kilowatt-hours.
Critical Safety Warning: All visual inspections should be conducted only when the system is completely de-energized. This means following a proper shutdown procedure, which includes turning off the DC disconnect switch(s) near the array and the AC disconnect switch at the inverter. Never handle DC wiring while the system is active, as the high voltage (often 300-600V DC) presents a severe electrocution hazard.
A maintenance check that identifies and corrects a 3% system-wide loss on a system that generates 1,500o fele ctricity annually recovers 45 per year. If the professional inspection costs $250, it pays for itself in energy savings alone in about 5.5 years, not including the avoided cost of a major repair down the line.
l Loose Terminal Lugs: In the combiner box or inverter, terminals can vibrate loose over 5-7 years, increasing resistance. Retorquing them to the manufacturer's specification (e.g., 25-30 inch-pounds) is a simple fix.
l Water Ingression in Connectors: If MC4 connectors are not fully snapped together or the rubber seals degrade, moisture can cause corrosion. This can increase resistance by over 1 ohm, leading to a 5-8% power loss in that circuit and posing a shock risk.
l Rodent Damage: Mice or squirrels can chew through PVC conduit or the cable insulation itself within a single season, creating a direct short circuit that will cause an immediate and total shutdown of the affected string.
Monitor System Performance Data
A surprisingly high number of system owners only realize they have a problem when they receive a unexpectedly high utility bill, by which point the performance issue may have been ongoing for months, resulting in substantial financial loss. For example, a single underperforming panel in a string inverter system, or a faulty optimizer, can drag down an entire array's output by 10-20% without triggering a full system shutdown. This silent degradation could mean losing 200 to 400 worth of electricity annually on a medium-sized system. Modern monitoring platforms provide real-time and historical data that transforms system maintenance from reactive to proactive, allowing you to identify a 5% dip in a string's efficiency within days, not seasons. The cost of a sophisticated monitoring system is typically 200 to 500 integrated into the initial installation, a small price to pay to protect a 20,000 to 40,000 asset and ensure it delivers the projected 8-12% annual return on investment.
The most critical metric is the Performance Ratio (PR), which is the ratio of the actual energy produced to the theoretically possible energy under ideal conditions. A PR of 80% or higher is generally good, but the key is to track its consistency. A sudden drop from 82% to 75% is a clear red flag. Your monitoring platform should allow you to track production on at least a daily basis. Set a simple benchmark: on a clear, sunny day, your system should produce a predictable amount of energy per kilowatt of capacity (kWh/kWp). For instance, a well-located 10 kW system might be expected to generate 50-60 kWh on a perfect summer day. If you consistently see 45 kWh on such days, you have a 10% performance gap to investigate.
Monitoring Level | Data Granularity | Typical Additional Cost | Problem Identification Capability | Estimated Annual Value in Recovered Energy |
System-Level (Basic) | Total daily/weekly production. | $0 (often included) | Poor. Can only detect a >15% total system failure. May take months to notice. | 0−50 |
String-Level (Intermediate) | Production data for each string of panels. | 100−300 | Good. Can identify a 10%+ underperformance in one string due to shading or a fault within days. | 75−150 |
Module-Level (Advanced) | Production data for each individual panel. | 300−500+ | Excellent. Can pinpoint a single underperforming panel or optimizer with 2-5% accuracy within hours. | 100−250+ |
Identifying an inverter fault that causes a 15% production loss within 3 days instead of 3 months can save you $150 in lost energy on a larger system. Most monitoring platforms allow you to set custom alerts. You should configure an alert for zero production (indicating a total system failure) and another for production that falls more than 20% below the forecast for a given day.A 5% degradation in production from one July to the next is normal panel aging, but a 12% degradation strongly suggests an issue like soiling, shading from new tree growth, or equipment malfunction.