Can a House Run 100% on Solar
A house can run 100% on solar power.
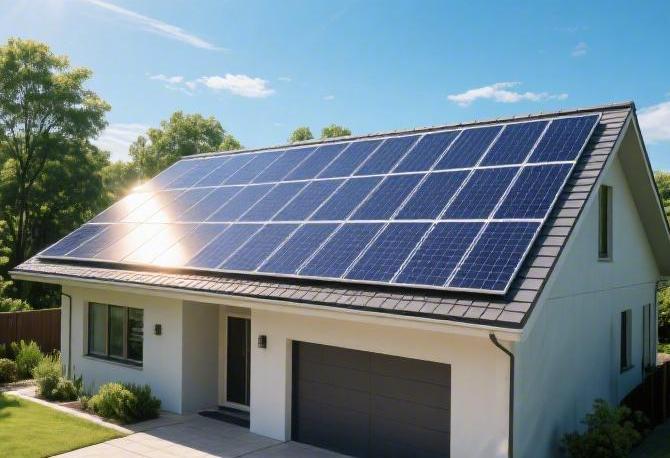
In practical operation, it requires installing an 8-kilowatt photovoltaic panel array paired with a 20-kWh large-capacity energy storage cell.
During the day, the photovoltaic system supplies power directly and fully charges the cell; at night, the cell continuously discharges through an off-grid inverter, thereby achieving 24/7 independent off-grid power supply.
Is It Really Possible
Is it really feasible?
Relying entirely on a photovoltaic array to sustain the operation of a detached house 24/7, totaling 8,760 hours over 365 days without any dependence on external power sources, has 100% operational feasibility on a physical and electrical engineering level.
The average indoor area of a residential home in the United States is 2,200 square feet. Equipped with an 11.2-kilowatt photovoltaic system consisting of 28 monocrystalline silicon modules, in a state like Arizona with an average of 280 sunny days per year, the total annual power generation can reach 16,500 kilowatt-hours (kWh).
The physical dimensions of a single photovoltaic panel are typically 1.7 meters long by 1.1 meters wide, with a rated output power specified between 400 watts and 420 watts, and a stable photoelectric conversion efficiency ranging from 20.5% to 22.8%. Its factory standards require that at the end of a 25-year lifecycle, it still maintains a current output capacity of no less than 84.2% of its initial peak power.
For a single-family house meeting the latest ASHRAE 90.2 building energy efficiency standards, the sum of its average annual heating load and basic electrical load is about 12,000 kWh. The 11.2 kW system's power generation exceeds the theoretical full demand by 37.5%, providing an absolutely sufficient power redundancy margin.
To accurately match a 100% supply-to-demand ratio, it is necessary to calculate the specific operating parameters and the average daily working hours within a 24-hour period for more than 15 high-energy-consuming terminals in the house.
l A home central air conditioner with a cooling capacity of 36,000 BTUs has a peak input power of 3,500 watts when running at full load. During hot summer months when the outdoor temperature exceeds 90 degrees Fahrenheit, running continuously for six hours a day will consume exactly 21 kWh of electricity.
l A 50-gallon storage electric water heater typically has a rated power of 4,500 watts for its internal heating element. Starting the heating program automatically for three hours a day maintains a stable daily power consumption of around 13.5 kWh.
l A pure electric vehicle equipped with a 75 kWh ternary lithium cell pack, based on a fixed daily commuting distance of 35 miles and an average power consumption of 0.28 kWh per mile, requires 9.8 kWh of supplementary charging daily via a 240-volt AC charging station.
l A 1,200-watt microwave oven running at full load in the kitchen, a 1,500-watt electric oven, and a Tier-1 energy-efficient double-door large refrigerator with a constant daily power consumption of 1.5 kWh combine for a daily basic electrical load fluctuating between 4.5 kWh and 5.5 kWh.
Must Store Electricity
To bridge the sunless physical cycle lasting up to 14 hours after sunset and several days of rainy weather, the system must be equipped with a chemical energy storage medium capable of an extremely high depth of charge and discharge. Otherwise, the 100% power self-sufficiency rate will instantly drop to 0% when the sun goes down.
For mainstream residential lithium iron phosphate (LiFePO4) cell packs on the market, the standard physical capacity of a single unit is set at 13.5 kWh, and the maximum Depth of Discharge (DoD) supported by the system allows reaching an extreme limit of 96% to 100%, yielding a user-extractable available capacity of 13 kWh.
A pure off-grid system completely detached from the public power grid requires electrical design standards to have a power reserve capacity capable of supporting the whole house's full-load operation for 3 consecutive rainy days. Calculated based on a basic daily power consumption of 30 kWh, the total capacity of the cell pack must reach an absolute threshold of 90 kWh.
Assembling such a heavy-duty energy storage array containing seven 13.5 kWh batteries will cause the direct cost of hardware procurement alone to soar to between $55,000 and $65,000, accounting for more than 65% of the total budget ratio of the entire solar installation project.
The charge-discharge cycle life of a cell exhibits a strict mathematical degradation ratio. Based on a high-frequency usage rate of 1.2 deep charge and discharge cycles per day, original factory cells nominally possessing a 7,000-cycle life will see their internal resistance increase by 25% to 30% after 15.9 years of continuous operation. This leads to an irreversible 20% loss in total physical energy storage capacity, forcing the homeowner into a hardware replacement cycle once every 15 years.
Connect to the Grid?
Integrating the photovoltaic inverter into the public grid system and activating a bidirectional Net Metering billing agreement is currently the optimal data model for over 98% of solar-installed households in the United States to maintain their annual power revenue and expenditure balance.
Under a 1-to-1 full retail net metering policy, excess AC kilowatt-hours generated by panels during peak daylight hours are injected directly into the grid, and the grid's bidirectional meter records this as monthly electricity bill credits at the full retail price of $0.15 per kWh. During the 12 hours of zero power generation output at night, the house draws power back from the public grid at the exact same unit price of $0.15 per kWh, incurring no price difference transaction fees greater than $0.
During the severe cold period from January to February in winter, because the solar incidence angle is as low as 25 to 30 degrees, the daily effective peak sun hours sharply reduce to 2.5 hours. The average daily power generation of a 10 kW photovoltaic array will plummet to 22 kWh, unable to fill the 13 kWh gap required by the whole house's electric heating, which consumes an average of 35 kWh per day.
By then, the 600 effective electricity bill credit points accumulated by over-generating 15 kWh per day during the summer period from July to August can be used at a 100% exchange ratio to equally offset the power deficit during the 3 months of winter. Adopting this grid-tied scheduling strategy, a family only needs to be equipped with a single backup cell with a capacity of 10 kWh to 15 kWh to cope with sudden grid paralysis accidents that occur on average 1.5 times a year and last no more than 4 hours per outage. This drastically compresses the initial investment budget for energy storage equipment to a low-cost range of $9,000 to $12,000.
At the Mercy of the Weather
The real-time AC output power of photovoltaic panels shows an extremely precise inverse or positive correlation function fluctuation relationship with the local average cloud cover from 0% to 100%, outdoor ambient temperature, and the physical installation geometric tilt angle of 15 to 45 degrees.
Under 100% overcast or heavily cloudy weather conditions, the amount of solar radiation penetrating the atmosphere drops significantly, and the number of photons captured by the silicon wafers decreases correspondingly. The actual output electrical power will drop sharply to an extremely low range of 10% to 25% of the product's rated maximum power. If the region where the house is located encounters continuous heavy rain with 100 mm of precipitation over 72 hours, a photovoltaic system with a nominal maximum power of 10 kW might only produce a cumulative total power output of 15 kWh to 20 kWh over the 3 days, making it difficult to 100% satisfy even the 10% basic operational power requirement of sustaining a refrigerator and five 10-watt LED lights.
Ambient temperature also has an explicitly clear negative inhibitory effect on the electron transition efficiency of monocrystalline silicon materials. The optimal operating surface temperature set by Standard Test Conditions (STC) is 77 degrees Fahrenheit. For every 1.8 degrees Fahrenheit increase in the panel's physical surface temperature, its output power will drop at a linear rate based on a fixed temperature coefficient of 0.34%.
In arid desert areas where the summer noon temperature reaches 100 degrees Fahrenheit, dark-coated photovoltaic panels absorb a large amount of infrared thermal energy, and their physical surface temperature typically skyrockets to 145 degrees Fahrenheit. This huge temperature difference of 68 degrees Fahrenheit will cause the overall power generation efficiency of the entire photovoltaic system to suffer an absolute power loss ratio of 11.5% to 12.8%.
If the roof tilt deviates from the optimal receiving incident angle range of plus or minus 15 degrees of the region's latitude—for example, adopting a 0-degree completely horizontal flush installation on a flat-roofed house—the exponential increase in light reflectivity will directly cause a loss of 8% to 12% in the power revenue ratio of the system's annual average total power generation.
Space Needs
Is There Enough Space?
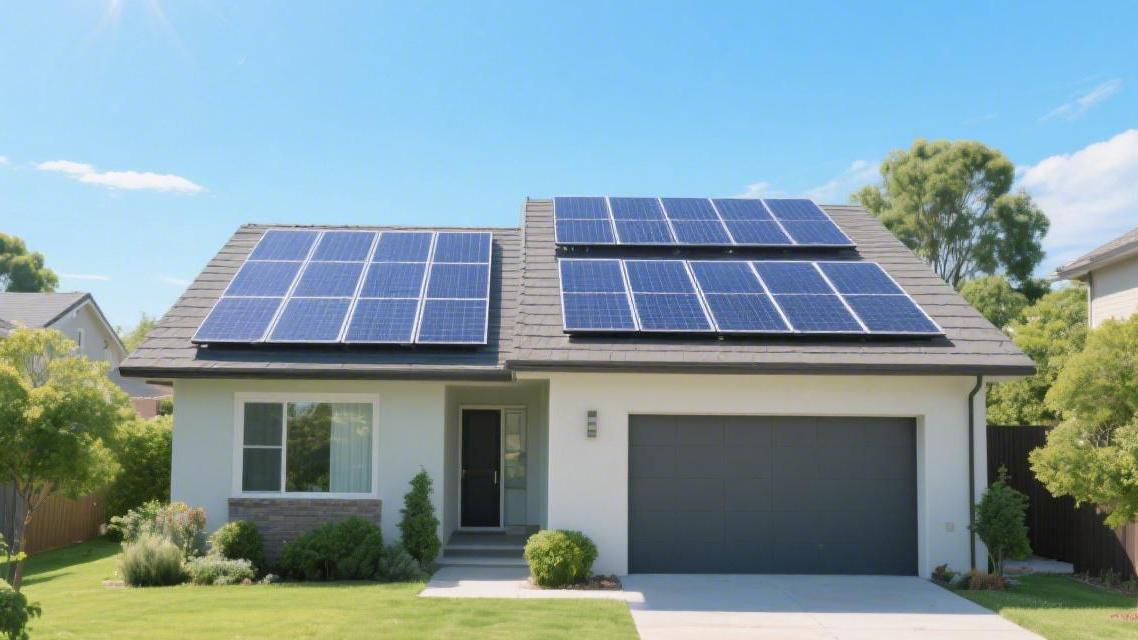
Mainstream residential-grade monocrystalline silicon photovoltaic modules on the market with output power in the 400-watt to 450-watt range generally have physical dimensions of 68 inches in length and 45 inches in width. The absolute physical surface area occupied by a single panel on the roof is 21.25 square feet.
Suppose an 11.2 kW photovoltaic system providing a 100% self-sufficiency rate is designed for a house with an average annual base electricity consumption of 12,000 kWh. Mathematically, it requires exactly 28 solar panels of the same specifications. Multiplying 28 by 21.25 yields a required 595 square feet of pure, unobstructed glass working area. The National Electrical Code (NEC) and local state regulations specify standard dimensions for roof fire access, requiring a continuous physical clearance space of no less than 36 inches in width along roof ridges and eaves to ensure high-altitude operations and smoke ventilation for firefighters.
After factoring the mandatory 30% to 40% setback ratio into the floor area ratio, a standard residential building must possess 850 square feet to 950 square feet of continuous structural plane facing south or west to have the physical conditions to accommodate an 11.2 kW power generation array. If the roof surface features dormer windows, multiple brick chimneys, and geometric splicing structures with different tilt angles, the variance of unusable invalid space will multiply, causing the minimum total roof gross area threshold required for the system to be forcibly pushed above 1,200 square feet.
According to the parameter specifications for solar installations on residential buildings formulated by the National Fire Protection Association (NFPA), any roof plane with a physical tilt angle greater than 9.5 degrees must maintain a continuous walking pathway with a width of absolutely no less than 0.91 meters between the physical edge of the photovoltaic array and the roof ridge line. Moreover, the vertical height difference between the highest point of the system hardware and the roof structural deck must not exceed 0.45 meters, in order to withstand extreme positive and negative wind load pressure test requirements of wind speeds up to 120 miles per hour.
The weight of a single 400-watt rated solar panel typically fluctuates between 42 pounds and 48 pounds, depending on the thickness of the tempered glass front panel and the specifications of the anodized aluminum frame. Superimposing the mass of the aluminum alloy mounting rails, stainless steel L-brackets, penetrating lag bolts, and microinverters or DC power optimizers all together, the entire hardware system will impose an additional physical dead load of 2.5 pounds to 3.2 pounds per square foot on the existing roof trusses.
A standard asphalt shingle roof built according to post-2000 building codes has a design-allowed dead load bearing capacity of 15 pounds per square foot, and the newly added 3 pounds of photovoltaic equipment weight falls entirely within the 20% safe engineering redundancy range. If the asphalt shingles on the house surface have been in use for over 12 calendar years and the surface granule loss rate has reached a 15% to 20% wear level, the 25-year rated operating lifespan of the newly installed photovoltaic array will far exceed the remaining 8-year physical degradation cycle of the roofing materials.
To carry out roof renovation work beneath an array already covered with 28 panels, the homeowner must pay up to $2,500 to $3,500 in labor costs for equipment removal and secondary reinstallation. A bill of pure expenditure will drag down the entire system's 10-year financial return rate by a full 14%. For old roofs with a calendar age exceeding 150 months, 100% of the old shingles must be stripped and the waterproofing layer repaved before fixing the metal brackets.
The geometric azimuth angle and the biological shading density of surrounding plants determine the true power generation yield per square foot of available area. A 900-square-foot sloped plane facing due south with an azimuth angle of 180 degrees can receive 100% of the baseline solar radiation intensity.
If the original orientation of the house forces the installation team to lay panels only on a purely east-facing roof with an azimuth angle of 90 degrees, the annual average power generation ratio of the entire array will inevitably drop by 18% to 22%. It becomes physically necessary to increase the number of panels from 28 to 34 to compensate for the power attenuation and maintain the 12,000 kWh annual output target, instantly inflating the total space requirement to 1,150 square feet. A mature oak tree located 40 feet away from the house with a canopy diameter of 30 feet may cast dynamic shadows covering 15% of the panel surface between 2:00 PM and 4:00 PM.
In a traditional string inverter topology, just 10% of the physical surface area being shaded will trigger a current bottleneck effect, causing the AC output power of the entire array string to plummet by 35% to 40%. When a roof lacks the statistical variance in load-bearing weight or cannot meet the strict square footage bottom line, a ground-mounted racking system becomes a mathematically viable spatial alternative.
A 12 kW ground-mounted photovoltaic array requires a standalone yard area 40 feet long and 15 feet wide, consuming a total of 600 square feet of ground plot ratio. Burying a 240-volt AC cable inside an insulated conduit 18 inches deep underground and extending it 100 feet to connect to the house's main distribution box involves trenching work that generates a fixed labor quote of $15 to $25 per linear foot. This floats the total project budget upward by $1,500 to $2,500 while maintaining the same 21% photoelectric conversion accuracy.
Confirm Core Requirements
Understand the Fundamentals
For older homes in the U.S. built before 1990, the rated current capacity of the main electrical panel usually stays within the lowest range of 100 amps or 125 amps. A power generation combo consisting of an 11.4 kW solar array and dual 13.5 kWh energy storage batteries will generate a continuous AC current of over 60 amps at full load output. Feeding a stable current of up to 60 amps into an old 100-amp busbar will trigger the upper limit constraint of the National Electrical Code (NEC) 120% rule, making it highly prone to frequent tripping of the main breaker due to excessive physical temperatures and increasing the probability of fire.
Upgrading the hardware specifications of the main panel to the modern peak standard of 200 amps or 225 amps requires paying licensed electricians a total material and labor fee ranging from $1,500 to $2,800. This budget item must be completed 2 to 3 weeks in advance before the start of the photovoltaic installation cycle.
In addition to the electrical panel capacity, an extremely high-precision data statistics of the house's energy consumption must be conducted. By installing a smart sub-metering module at the main meter end to continuously collect real-time current samples for 30 to 60 days, the collected data is used to calculate the true load intensity and peak dispersion of each independent electrical circuit during 24-hour periodic variations, thereby yielding a median daily kWh consumption with an extremely small standard deviation.
If the original house has physical volumetric defects such as drafty single-pane windows, attic insulation cotton thickness below R-30 specifications, or HVAC duct air leakage rates up to 15%, blindly increasing the number of photovoltaic panels to offset energy waste will lead to a compound reduction rate of 2.5% per year in the overall system's ROI. Spending $800 to $1,200 in pure cash to perform whole-house sealing and insulation upgrades prior to installing solar hardware can proportionally drive down subsequent equipment procurement costs by 10% to 15%.
l Evaluate the instantaneous surge load when household appliances start up: A 4-ton central air conditioning compressor operating for over 10 years will, in the extremely short timeframe of 0.5 to 1.5 seconds upon power-up, pull grid current at an intensity peaking at 3 to 4 times its continuous running power, generating an instantaneous peak AC load of up to 14,000 watts. If the maximum instantaneous overload capacity of the paired inverter cannot withstand the huge current amplitude fluctuations at this frequency, the statistical probability of a blackout crash across the entire microgrid system will soar above 95%. A soft starter with a market price of around $300 must be installed in advance to reduce the peak of the compressor's starting current by 60% to 70%.
l Confirm the microclimate indicators of the physical environment where energy storage equipment is installed: The chemical reaction rate inside a Lithium Iron Phosphate (LiFePO4) cell pack is highly sensitive to and correlated with the physical temperature and relative humidity of its surrounding space. Its factory-calibrated optimal operating temperature range is strictly limited between 50 and 86 degrees Fahrenheit. If large batteries are installed in an uninsulated, enclosed garage in Arizona where summer highs reach 115 degrees Fahrenheit, the excessive thermal stress will trigger accelerated degradation of the electrolyte inside the cell. This causes the long-term degradation ratio of the total storage capacity to be 35% higher than in a normal room temperature environment, and the actual physical cycle life will severely deviate from the design median, even resulting in a negative absolute deviation that shortens it by 3 to 5 years.
l Calculate the distribution ratio of power consumption on the day-and-night timeline: By extracting detailed kWh consumption from the past 12 months using historical utility bills and running rigorous linear regression calculations, it can be found that for a dual-income household equipped with two pure electric vehicles, 70% of electricity usage frequency and 85% of energy consumption density are often concentrated between 6:00 PM and 11:00 PM—a physical cycle completely devoid of sunlight. Given this highly dispersed nighttime usage pattern, the absolute physical area and rated peak power of the solar array are no longer the sole variables dictating the system's success or failure. The continuous discharge precision of the inverter and the voltage operational stability of the cell cabinet under 80% Depth of Discharge (DoD) become the prerequisite parametric conditions to keep the house's 120-volt AC grid online.
Household Appliance Category | Continuous Running Power (Watts) | Startup Instantaneous Peak (Watts) | Avg Daily Usage Time (Hours) | Median Daily Power Consumption (kWh) | Load as Percentage of Total Capacity |
Heat Pump AC System (3-ton spec) | 3500 | 10500 | 6.5 | 22.75 | 38.5% |
Storage Electric Water Heater (50-gallon volume) | 4500 | 4500 | 2.8 | 12.60 | 21.3% |
Pure EV Charging Station (Level 2, 240V) | 7600 | 7600 | 4.0 | 30.40 | 51.5% |
Inverter Side-by-Side Refrigerator (28 cubic feet) | 150 | 600 | 10.0 | 1.50 | 2.5% |
Electric Heating Dryer (7.4 cubic ft capacity) | 5400 | 5600 | 0.8 | 4.32 | 7.3% |
Yard Well Water Pump (1 HP strength) | 750 | 2200 | 1.5 | 1.12 | 1.9% |
After cross-checking all hardware load specifications and environmental temperature and humidity indicators, an engineering approval document containing detailed wiring diagrams, structural static test numerical reports, and wind load parameters must be submitted to the local city building and safety department.
The median average wait time for the entire document review cycle nationwide is 22 natural working days, with some less administratively efficient counties and cities even experiencing approval lag errors of up to 45 days. Building permits issued by municipal departments generally incur a fixed processing fee of $400 to $800, and the interconnection agreement application required by the utility company also requires an additional grid-connection calculation fee of $150 to $250. Purely monetary expenditures must be fully accounted for in the overall budget spreadsheet of the upfront installation project, as they are ineligible for the 30% tax credit incentive provided by the federal government.
When installers lay cables on the roof, every wire passing through the attic must be encased in a metal conduit with a physical diameter of no less than 0.75 inches to meet the anti-physical puncture strength specifications set by the National Fire Protection Association (NFPA), preventing an abnormal increase in the probability of short-circuit fires caused by rodent chewing. Only after the entire photovoltaic system is completely finished and successfully passes the physical inspection test by a local electrical inspector can the inverter officially start the DC to AC conversion process.
If the inverter's maximum continuous output rating is set to 7,600 watts, and multiple large appliances in the entire house simultaneously start at 7:00 AM with a 100% probability, pushing the total AC current load to an extreme range of 8,500 watts, the excess 900 watts of electrical energy flow cannot be internally calculated and digested through the cell end. If there are no conditions for the public grid to input additional current at this moment, the voltage fluctuation dispersion of the entire internal home microgrid will immediately exceed the allowable error limit of 5%, causing sensitive computer equipment to automatically shut down and reboot. When planning the ultimate index parameters of photovoltaic power generation equipment, it must be ensured that the actual power distribution of the highest-frequency daily electricity superposition combinations always falls within the 80th percentile of the overall designed maximum capacity.