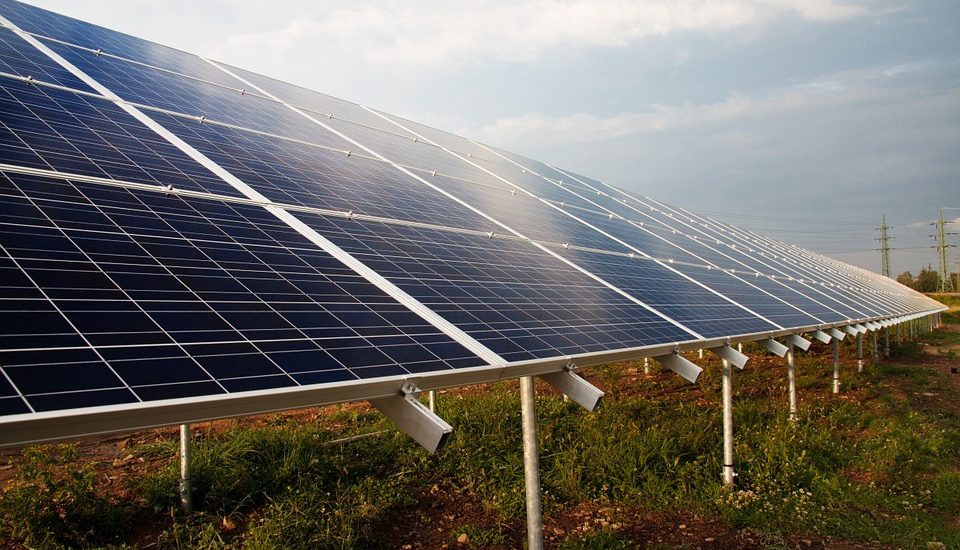
What Factors Affect the Efficiency of Small Solar Modules
Small solar efficiency dips 0.5% per 10°C rise (NREL data); dust coats cells, slashing output 5-10% monthly—biweekly cleaning and angling toward sun optimize light capture, countering losses.
Solar Cell Material Types
The solar market is overwhelmingly dominated by silicon-based technologies, which account for more than 95% of all modules produced globally. Within this category, you have three main contenders, each with a distinct balance of efficiency, durability, and price. Understanding these differences is crucial because the choice of material directly impacts how much energy you can harvest from a limited surface area, especially on a small module.
A standard 156mm x 156mm monocrystalline cell used in many small panels typically converts between 20% to 22% of incoming sunlight into electricity, with premium models now exceeding 24%. This means you get more watts from a smaller area. A panel using these cells might achieve a power output of 15 watts from a surface area that would only produce 12 watts with other technologies. However, this premium performance comes at a cost; the intricate manufacturing process makes monocrystalline panels approximately 10-15% more expensive than their polycrystalline counterparts.
The efficiency of a standard polycrystalline cell is lower, generally in the range of 16% to 18%. Consequently, a small module using polycrystalline cells will be physically larger than a monocrystalline module of the same wattage. A 10-watt poly panel might need to be 15-20% larger in surface area to match the output of a 10-watt mono panel.
A key real-world differentiator is the temperature coefficient. Monocrystalline panels typically have a better temperature coefficient (around -0.3% to -0.35% per °C) than polycrystalline (around -0.4% to -0.45% per °C), meaning they lose less power on a hot day.
Their efficiency, however, is significantly lower, often between 7% and 10% for consumer-grade modules. This means a 10-watt amorphous silicon panel could be 2 to 3 times larger than a comparable monocrystalline panel. Their major advantage lies in performance under high temperatures and diffuse light (e.g., cloudy days); they experience a much smaller drop in output as temperature rises. They are also less affected by partial shading. However, the main drawback, besides low efficiency, is a higher degradation rate. While crystalline silicon panels degrade at about 0.5% per year, thin-film can degrade at 1% or more annually, meaning they lose their peak power output faster over a 20 to 25-year lifespan.
Effect of Sunlight Angle
A module pointed directly at the sun might produce its full 100 Watts. Rotate it just 15 degrees off-axis, and the power can drop by 3-5%. At a 45-degree angle, you've likely lost 30% of your potential power. And when the panel is parallel to the light rays (a 90-degree angle), the output plummets to near zero. This principle, governed by the cosine law, means that for small modules used on stationary objects, daily and seasonal sun paths cause massive fluctuations in energy generation, easily totaling 40% or more loss compared to an ideally tracked system over a full day.
The formula is I_effective = I_incident * cos(θ), where θ is the angle between the light ray and a line perpendicular to the surface (the normal).
A 0-degree angle of incidence (sun perfectly perpendicular) gives you cos(0°) = 1, meaning 100% of the light's intensity is captured. At a 60-degree angle, cos(60°) = 0.5, so the panel only receives 50% of the potential light, effectively halving the available power. This is why the sun's low position in the sky during winter months or early mornings/late afternoons results in such weak generation.
Angle of Incidence (θ) | Cosine (cos θ) | Relative Power Output (%) | Practical Example |
0° | 1.00 | 100% | Solar noon, panel directly facing sun. |
15° | 0.97 | ~97% | Slight misalignment, minor loss. |
30° | 0.87 | ~87% | Sun moving in the sky, ~1-2 hours from solar noon. |
45° | 0.71 | ~71% | Significant power reduction. |
60° | 0.50 | 50% | Early morning/late afternoon or poor seasonal tilt. |
For a small, fixed module—like one on a balcony, a shed roof, or a security light—this cosine loss is the dominant factor in your daily energy harvest. You can't change the sun's path, but you can optimize your panel's fixed position. For example, a module fixed at your latitude's angle (e.g., 34 degrees if you're in Los Angeles) will typically yield the highest annual total energy. However, if your need is seasonal, you should adjust accordingly; a steeper tilt (e.g., 50-60 degrees) is better for capturing low winter sun, while a shallower angle (e.g., 20-30 degrees) optimizes for summer. Data shows that a single, fixed optimal tilt can recover about 95% of the energy achievable with a complex and expensive dual-axis tracker over a year.
Impact of Temperature on Output
While sunlight increases current, heat actually reduces the voltage a solar cell can produce. This isn't a minor issue; for every degree Celsius the cell temperature rises above the standard test condition of 25°C, the power output drops by a predictable percentage. A typical crystalline silicon module has a coefficient ranging from -0.3% to -0.45% per °C. On a sunny day where the ambient temperature is a pleasant 25°C, the surface of a dark solar panel can easily reach 45-50°C or higher. That's a 20-25°C increase above the testing standard. Applying the coefficient, a panel rated for 100 watts at 25°C might only be producing about 94 watts in these real-world conditions, an immediate 6% loss before considering any other factors. In extreme heatwaves with cell temperatures hitting 70°C, the power loss can exceed 15%.
The temperature coefficient for open-circuit voltage (Voc) is much more severe, typically around -0.3% to -0.4% per °C, which is why system designers must account for the lowest expected temperatures to avoid overvoltage damage to charge controllers. The impact is not uniform across all technologies.
·
Monocrystalline/Polycrystalline Silicon: These are the most common and suffer the most, with the -0.3% to -0.45%/°C range. Premium panels often boast a better coefficient, closer to -0.26%/°C, which can translate to a 2-3% power advantage on a hot day compared to a standard panel.
·
·
Thin-Film (Amorphous Silicon): This technology has a significantly better temperature coefficient, often around -0.20%/°C. This means in a high-temperature environment of 50°C, a thin-film module might only experience a 5% power loss from its rated capacity, while a standard silicon module could lose 7.5% or more. This can make thin-film more effective in consistently hot climates.
·
800 W/m² irradiance, 20°C ambient, and 1 m/s wind speed. A module with a NOCT of 45°C will typically run cooler and perform better in the field than a similar wattage panel with a NOCT of 48°C. The difference of 3°C equates to roughly a 1% performance gain for the cooler-running panel under average conditions. To mitigate losses, ensure a gap of at least 4-6 inches behind the panel for passive air cooling. Mounting on a dark roof without an air gap can increase operating temperature by 10-15°C compared to a ground-mounted rack, creating a 3-5% permanent power penalty during sunlight hours.
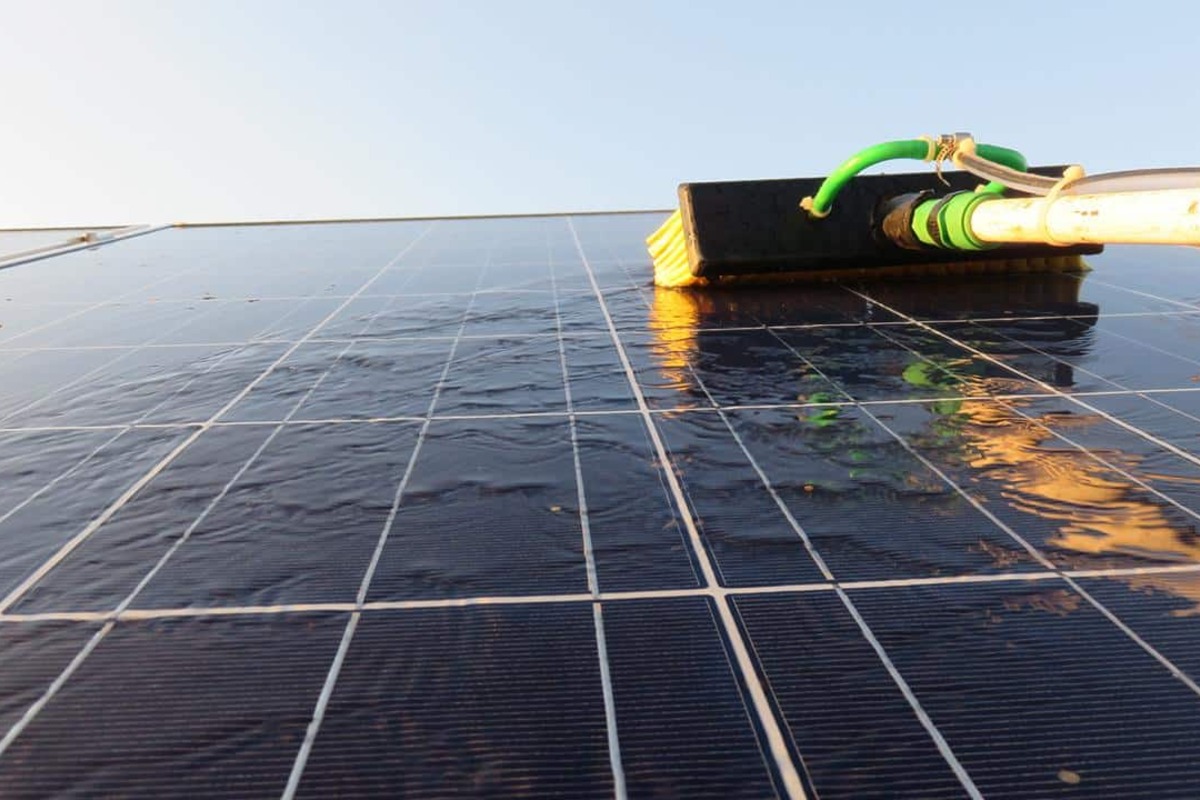
Dust and Shade Effects
Studies from the National Renewable Energy Laboratory (NREL) show that dust accumulation reducing light transmission by just 5% can cause a proportional power loss of 3-5%. In arid environments, going one month without rain or cleaning can lead to dust-related losses averaging 8-10%, with peaks over 20% following prolonged dry spells or events like dust storms. Shade, however, is far more destructive. Unlike an ideal source, where power drops linearly with reduced light, partial shade on a modern panel with bypass diodes creates a highly non-linear response. Even a shadow covering just 5% of the panel's surface area—the size of a leaf—can easily cause a 30-50% drop in total power output, not the 5% one might expect.
Most 36-cell panels, common for 12V systems, are configured with two bypass diodes, each protecting a string of 18 cells. If one cell in a string is heavily shaded, it stops producing power and acts as a resistor, overheating and blocking current flow for the entire 18-cell chain.
·
Uniform Dust: Causes a relatively predictable, linear reduction in light intensity across all cells. A 0.1 mm layer of dust can block 5-10% of incoming light. The loss is proportional because it affects every cell equally.
·
·
Partial Shade (on a single cell): This is the critical failure mode. A shaded cell's current output drops. Since the cells are connected in series, the current of the entire string is limited to that of the weakest (shaded) cell. The power loss is disproportionate.
·
·
Hard vs. Soft Shade: A sharp, solid shadow from a pole ("hard shade") is more damaging than the diffuse shade from a tree ("soft shade") because it creates a starker contrast between fully illuminated and fully dark cells, forcing bypass diodes to engage more decisively.
·
The following table illustrates how different types of shade on a typical 20W panel can affect output.
Shade Scenario | Approximate Area Affected | Typical Power Output | Power Loss | Mechanism |
No Shade / Clean | 0% | 20.0 W | 0% | Baseline performance. |
Light Dust Layer | 100% (uniform) | 18.5 W | ~7.5% | Uniform reduction in light transmission. |
Shadow on 1 Cell | ~3% of total area | 10.0 W | ~50% | One 18-cell string disabled by its bypass diode. |
Shadow on 1 Full String | ~50% of total area | 10.0 W | ~50% | One bypass diode active, half the panel offline. |
Bird Dropping on 1 Cell | <1% of total area | 9.5 W | >50% | Severe localized shading, effectively killing the cell's output and its string. |
For dust, tilting the panel at an angle of at least 15 degrees allows rain to provide a self-cleaning effect, reducing accumulation rates by over 60% compared to a flat installation. A monthly cleaning with water can recover 95-98% of lost performance. For shade, there is no electronic fix; prevention through placement is the only solution. Spend time observing the sun's path over the course of a full day and across different seasons before permanently installing a panel. A location that is shaded for even 30 minutes per day can reduce the system's total daily energy harvest by 10% or more. Using micro-inverters or DC power optimizers can mitigate shade loss in larger systems, but for a single, small module, intelligent placement is the most cost-effective strategy, offering a potential 20-30% energy yield improvement over a poorly sited unit.
Panel and System Wiring
The core issue is voltage drop, governed by Ohm's Law (V = I * R). A standard 18V panel might only be 16V at the end of a thin, long cable. Since most charge controllers need a minimum voltage differential (often 1-2V) above the cell to push current, that lost 2V can be the threshold between charging and not charging. Using a cable with a 1 mm² cross-section for a 10-foot run with a 5-amp current can result in a voltage drop of over 5%. Over a 20-foot round-trip circuit, this loss can easily exceed 8%, effectively wasting 2 watts of a 25-watt panel's output before it even reaches your cell.
The two most critical factors in wiring are the American Wire Gauge (AWG) thickness and the total circuit length. The resistance of a wire increases as its diameter decreases and its length increases. For a typical small system with a maximum current of ~5 amps, the choice of wire gauge is decisive.
·
Wire Gauge (AWG): This standard defines the diameter of the wire. A lower AWG number means a thicker wire with less resistance. For a 5-amp current, a 10-foot long 16 AWG cable has a resistance of about 0.04 ohms, while a much thinner 20 AWG cable of the same length has a resistance of 0.10 ohms—2.5 times higher. This higher resistance translates directly into greater power loss as heat.
·
·
Circuit Length: This is the total one-way distance from the panel to the charge controller plus the return path. Doubling the cable length doubles the resistance and the voltage drop. A 25-foot total circuit will have 2.5 times the loss of a 10-foot circuit using the same wire.
·
The following table shows the practical impact on a system with a 5-amp current, a common maximum for 50-60W panels.
Total Circuit Length | 16 AWG Cable (Resistance: ~0.016 Ω/m) | 18 AWG Cable (Resistance: ~0.025 Ω/m) | 20 AWG Cable (Resistance: ~0.040 Ω/m) |
10 feet (3m) | Voltage Drop: ~0.24V | Voltage Drop: ~0.38V | Voltage Drop: ~0.60V |
| Power Loss: ~1.2W (2.4%) | Power Loss: ~1.9W (3.8%) | Power Loss: ~3.0W (6.0%) |
25 feet (7.6m) | Voltage Drop: ~0.61V | Voltage Drop: ~0.95V | Voltage Drop: ~1.52V |
| Power Loss: ~3.0W (6.0%) | Power Loss: ~4.75W (9.5%) | Power Loss: ~7.6W (15.2%) |
Standard MC4 connectors used on most panels have a contact resistance of less than 0.5 milliohms when new and clean. However, if they become corroded or loose, this resistance can jump to 10-50 milliohms, acting like a small heater and wasting another 0.5 to 2.5 watts of power at 5 amps. For a small panel, this is significant. Always use a wire gauge that keeps the total voltage drop below 3% for the 12V side of the system. If your panel's maximum power current (Imp) is 4 amps and the run is 15 feet, you likely need at least 16 AWG cable. For runs over 30 feet, stepping up to 14 AWG or even 12 AWG is a cheap and effective way to recapture lost energy.
Real-World Placement Considerations
A poorly chosen location can easily negate 30-50% of your potential energy harvest, regardless of the panel's quality.The sun's altitude at solar noon in a location like Chicago varies from a low of about 26 degrees in late December to a high of 71 degrees in late June—a massive 45-degree difference. A panel fixed at a 45-degree angle, perfect for spring and fall, will suffer significant losses in summer and winter. For a permanent, fixed installation, the best compromise for maximizing annual yield is to set the tilt angle equal to your local latitude. For example, in Denver, Colorado (approx. 40°N latitude), a fixed tilt of 40 degrees will typically capture over 95% of the energy achievable with an expensive tracking system that adjusts daily.
A spot that appears perfectly sunny at 2:00 PM in July might be deeply shaded by a neighboring chimney or tree branch at 10:00 AM in November, when the sun is low in the southern sky. The impact is cumulative; even 30 minutes of shade during the peak sun hours of 10 AM to 2 PM can reduce your daily energy production by 15-20%. Before mounting anything permanently, it is absolutely essential to conduct a site survey. The most effective method is to physically visit the proposed site every 2-3 hours throughout the course of a full day, and to do this during a key season like winter or summer. Better yet, use a $20 solar pathfinder or a smartphone app with an augmented reality overlay to visualize the sun's path across the sky for every month of the year. This upfront investment of 2-3 hours of planning can prevent a 20-30% annual energy deficit.
For a small 50W system, a one-time investment of 2 hours to find the optimal, unshaded location with a proper tilt angle can yield more additional energy over a year than spending $50 on a marginally more efficient panel. Avoid the temptation to place the panel in a convenient but suboptimal location, like a north-facing wall (in the Northern Hemisphere) or a spot that gets shaded by a porch roof for half the day. The concept of "solar access" is measured in hours of direct sun, and for a viable system, you need a minimum of 4-5 peak sun hours per day on average throughout the year. Also, remember that the environment changes; a tree that doesn't shade the panel today will grow 1-2 feet per year, potentially casting a critical shadow within 24-36 months. Plan for this growth by observing the site from the winter sun angle, when shadows are the longest. Finally, factor in accessibility for semi-annual cleaning; a panel placed in a hard-to-reach spot is less likely to be maintained, leading to a steady 5-10% loss from dust accumulation. The best placement optimizes for a combination of full sun exposure, cool operating temperatures, and easy maintenance, ensuring you get the maximum return from your investment over its 20-25 year lifespan.