What Are the Types of Solar Energy | 3 Main
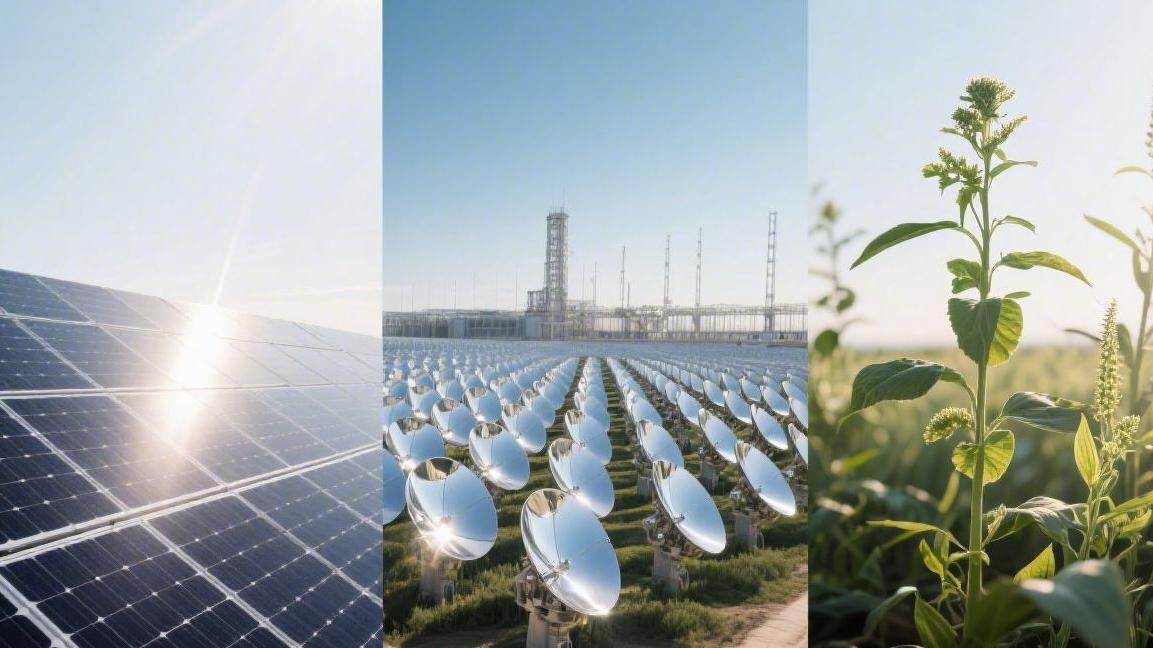
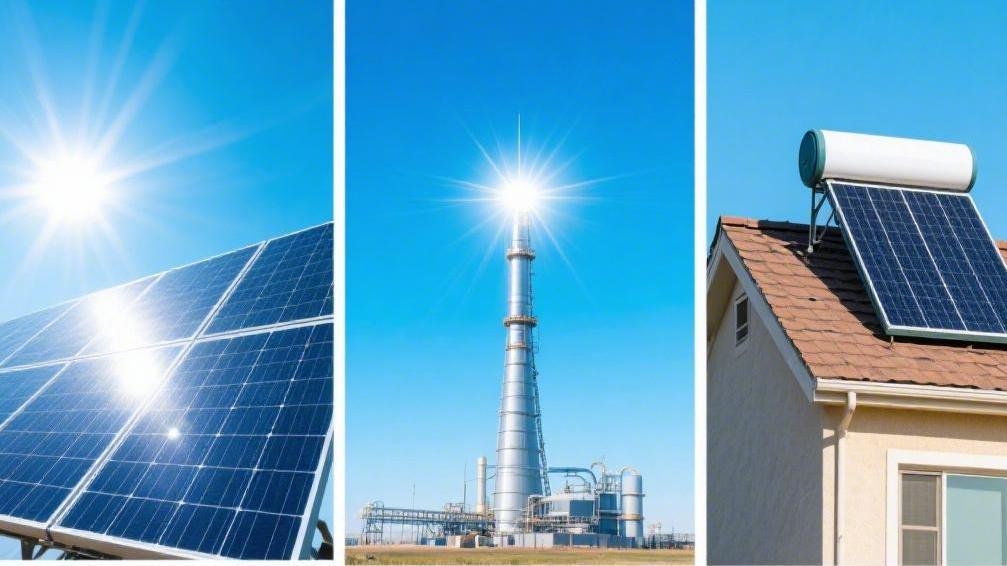
Photovoltaic power generation (efficiency approx. 20% with direct power supply), solar thermal power generation (utilizing concentrated energy storage for 24-hour continuous supply), and passive utilization (achieving up to 50% energy savings through architectural design).
These professional technologies each play their part, scientifically helping households and industries significantly reduce energy expenditures.
Photovoltaics (PV)
How Electricity is Generated
PV panel power generation relies on the PN junction within semiconductor materials.
When photons strike the surface of the silicon wafer, hundreds of millions of electrons are excited and displaced every second, forming direct current (DC).
Under 2024 mass production standards, over 95% of PV modules on the market utilize monocrystalline silicon technology.
The internal silicon purity must reach above 9.9999%, a high-purity requirement that ensures low-loss transmission of electrical energy at the microscopic level.
The control of microscopic loss determines the cell type and macroscopic efficiency.
Currently, the theoretical conversion efficiency limit for P-type PERC cells is approximately 24.5%, while emerging N-type TOPCon cells can break through the laboratory upper limit of 28.7%.
In actual mass production, shipment data from mainstream manufacturers in 2023 shows that the average efficiency of N-type modules is about 1.2% to 1.8% higher than that of P-type.
On the same 100-square-meter roof, installing N-type modules can generate nearly 500 watts more power.
Technical Indicator | P-type Cell (PERC) | N-type Cell (TOPCon) | HJT Heterojunction Cell |
Average Mass Production Efficiency | 23.2% | 25.1% | 25.8% |
Temperature Coefficient | -0.34%/℃ | -0.30%/℃ | -0.26%/℃ |
Bifaciality Rate | 70% | 80% | 90% |
Carrier Lifetime | Approx. 100 μs | Over 1000 μs | Over 2000 μs |
Which One Generates More Power
Maintaining this power increment requires that the modules do not suffer significant performance drops over an operating cycle as long as 30 years.
The material structure of the solar cell directly determines the stability of the power output.
According to sampling surveys of 200 power stations in different climate zones globally, N-type modules typically have a first-year power generation 3% to 5% higher than P-type modules of the same power rating, as they do not suffer from Potential Induced Degradation (PID) caused by boron-oxygen pairs.
The actual performance of PV cells is also affected by the solar spectral distribution.
Monocrystalline silicon has the highest absorption rate for light with wavelengths between 300 nm and 1100 nm, which accounts for over 80% of the ground solar energy.
To improve absorption efficiency, the surface of the solar cell is usually coated with a silicon nitride anti-reflective film with a thickness of approximately 70 nm to 90 nm.
This layer can reduce the reflectivity of the silicon wafer surface from 35% to below 2%.
Conversion Phase | Loss Percentage | Remaining Energy % | Influencing Factors |
Surface Reflection | 2% - 5% | 95% - 98% | Anti-reflective film quality |
Thermal Conversion | 60% - 70% | 25% - 30% | Energy exceeding bandgap limit |
Internal Resistance | 1.5% - 3% | 22% - 27% | Busbar spacing and material |
Inverter Loss | 1% - 2.5% | 21% - 25% | Circuit conversion efficiency |
How Many Years It Can Withstand
Hardware durability is directly linked to an operating cycle of 25 to 30 years.
According to IEC 61,215 standard testing, the first-year power degradation of qualified PV modules should be controlled within 2%, with subsequent annual degradation not exceeding 0.55%.
After undergoing 200 cycles of high and low temperature impact tests from -40°C to 85°C, the mechanical load of high-quality modules can still withstand a pressure of 5400 Pascals per square meter.
This is equivalent to covering the panel with 1.5 meters of accumulated snow without generating micro-cracks.
Modules exposed for long periods must also deal with the risk of Potential Induced Degradation (PID).
Experimental data shows that in extreme environments of 85% humidity and 85°C temperature, the power drop of low-quality modules can exceed 10% within 96 hours.
By using dual-glass encapsulation technology—adding a layer of 2.0 mm tempered glass to the back of the module—water vapor permeability can be reduced to near zero, extending the system's design life from 25 years to over 30 years.
Degradation Parameters | Remaining Power after 25 Years | Annual Degradation Rate | Physical Load Limit |
Single-Glass Module | 80.0% - 83.1% | 0.55% - 0.7% | 5400 Pa (Front) |
Dual-Glass Module | 85.4% - 87.2% | 0.4% - 0.45% | 2400 Pa (Back) |
Flexible Module | 75.2% - 80% | 0.8% - 1.0% | 2400 Pa (Front) |
Where the Power Goes
When DC power from photoelectric conversion is converted to AC power via an inverter, the conversion efficiency is usually maintained between 97.5% and 99%.
Power losses caused by cable transmission and dust shading account for about 3% to 5%.
A study of 1,500 power station samples worldwide shows that if the dust accumulation on the panel surface reaches 1 gram per square meter, the overall power generation efficiency will drop by about 4.2%.
Therefore, equipping an automatic cleaning system can increase annual power generation by about 8% to 12%.
Energy loss is also closely related to ambient temperature. Monocrystalline silicon cells have a negative temperature coefficient characteristic; typically, for every 1 degree Celsius increase in panel temperature, the output power drops by about 0.3% to 0.4%.
When rooftop panel temperatures reach 65°C in summer, even with ample sunlight, the actual output power will be about 12% to 16% lower than the rated 25°C laboratory parameters.
Thus, the ventilation gap at the back of the modules must be maintained at 10 cm or more to assist heat dissipation.
Loss Link | Loss Percentage | Optimization Method | Potential Yield Increase |
Cable Voltage Drop | 1% - 2% | Increase wire diameter/shorten distance | 0.5% - 1% |
Inverter Conversion | 1.5% - 3% | Select SiC power devices | 1% |
Shading Obstruction | 10% - 30% | Install power optimizers | 15% - 25% |
Dust and Dirt | 3% - 15% | Regular cleaning/anti-soiling coatings | 5% - 10% |
Calculating the Cost
Module costs currently account for about 45% of the total system budget.
The remaining expenditures are distributed among inverters (about 10%), brackets and cables (about 15%), and labor installation fees (about 30%).
From 2022 to 2024, the price of polysilicon material dropped from 300,000 RMB per ton to less than 60,000 RMB.
This drastic fluctuation caused terminal installation unit prices to drop by nearly 40%, shortening the pure commercial payback period for household users to 5.8 years without considering government subsidies.
Calculating the return on investment (ROI) also requires considering maintenance costs. Typically, 0.5% to 1% of the initial investment is reserved annually for operations and maintenance (O&M), used to replace potentially damaged inverter capacitors or connectors.
According to statistics from 10,000 installation cases, in areas with an average of 4.5 sunshine hours per day, a 5 kW system costing $5,000 typically yields an internal rate of return (IRR) between 12.5% and 18.2%.
Budget Item | Percentage (%) | Ref. Price (per Watt) | Expected Life (Years) |
PV Modules | 40% - 50% | 0.12 - 0.18 USD | 25 - 30 |
Inverter | 8% - 12% | 0.03 - 0.05 USD | 10 - 15 |
Installation Labor | 25% - 35% | 0.08 - 0.12 USD | N/A |
Grid Connection | 5% - 10% | 0.02 - 0.04 USD | 20 |
Is It Heavy?
A single 550W class module typically measures 2,278 mm by 1,134 mm and weighs about 28.5 kg. Installation design must account for a static load capacity of approximately 15 kg per square meter of the roof.
To maintain structural stability over an operating cycle of 100,000 hours, the bracket system must use aluminum-magnesium-zinc plated material with a thickness of no less than 2.5 microns to withstand extreme weather pressures with wind speeds exceeding 30 meters per second.
The compatibility of physical specifications determines installation efficiency. Currently, the tilt angle of mainstream brackets needs to be adjusted according to local latitude.
For example, in a 30°N latitude area, setting a fixed tilt of 25° to 30° can increase total annual radiation by more than 15% compared to flat placement.
While this angle adjustment increases structural module costs by about 5%, it can generate about 18,000 additional kWh of electricity over a 20-year operation period by improving the normal incidence rate of light, yielding economic benefits far exceeding the initial investment.
Solar Thermal
How It Collects Heat
Solar thermal technology utilizes absorbers to capture infrared and visible light from sunlight, converting its kinetic energy into molecular thermal motion.
Currently, over 85% of household collectors on the market use selective absorption coatings, which can achieve an absorption rate of 94% to 96% for the solar spectrum.
This extremely high absorption efficiency is due to the cermet (ceramic-metal) structure on its surface, a microscopic structure that determines the speed at which heat is transferred to the circulating medium.
Collection Parameters | Flat Plate Collector | Vacuum Tube Collector | Concentrated Solar Power (CSP) |
Absorption Rate (α) | 0.91 - 0.95 | 0.93 - 0.96 | 0.95 - 0.98 |
Emissivity (ε) | 0.05 - 0.12 | 0.04 - 0.06 | 0.07 - 0.10 |
Operating Temp Range | 30℃ - 80℃ | 50℃ - 120℃ | 300℃ - 800℃ |
2024 Market Share | Approx. 45% | Approx. 38% | Approx. 5% |
Once heat is absorbed, it must be transported to the water storage tank via a heat transfer medium. The flow characteristics of the medium affect the overall heat exchange capacity.
With the flow rate maintained between 0.015 and 0.02 liters per second per square meter, the fluid inside the copper pipes can carry away more than 90% of the heat from the absorber plate.
This efficient fluid circulation allows the system to heat the circulating liquid to over 55°C even when the ambient temperature is -10°C.
Inside the Tubes
The vacuum inside vacuum tubes typically needs to be maintained below 5 x 10^-3 Pascals to block heat loss from air convection.
Pressure monitoring results of 3,000 sets of vacuum tubes in 2023 showed that after 15 years of operation, high borosilicate glass tubes still maintained their vacuum at over 92% of the initial state.
Because the vacuum layer effectively inhibits heat dissipation, the daily average heat output of these systems in winter is about 25% higher than that of ordinary flat-plate systems.
· Glass Thickness: Standard tube wall thickness is 1.6 mm to 2.0 mm, capable of withstanding the direct impact of 30 mm hailstones.
· Startup Speed: Gravity heat pipes can start within 2 minutes of sunlight exposure, with a heat transfer rate 10 times faster than ordinary water circulation.
· Anti-freeze Performance: Using antifreeze as the circulating medium, pipe bursting will not occur even in extreme environments of -35°C.
· Coating Life: Coatings produced by three-target magnetron sputtering do not peel off after 2,000 hours of continuous exposure at 250°C.
Good insulation performance is reflected not only in the collection tubes but also in the delivery pipes connecting the collector and the water tank.
These pipes are usually wrapped in rubber-plastic insulation cotton with a thickness of 20 mm to 35 mm, with a thermal conductivity as low as 0.035 W/(m·K).
Low thermal conductivity ensures that over a long delivery path of 15 meters, the water temperature drop is controlled within 0.5°C to 1.2°C.
Storing for Use
The collected thermal energy is stored in water tanks with high-density polyurethane foam layers, where the insulation density is typically set at 40 kg/m³.
An experimental report on 500 units of 200-liter storage tanks noted that when the outside temperature is 5°C, the natural temperature drop of the tank within 24 hours is only 1.5°C to 3°C.
More than 98% of the heat collected during the day can be retained for use at night and the next morning, reducing the frequency of auxiliary electric heating startup.
Storage Details | Quantitative Data | Performance Indicator | Remarks |
Insulation Thickness | 50 mm - 60 mm | 24 h Heat Loss < 2% | Polyurethane foam material |
Inner Tank Material | SUS304 / SUS316L | Pressure 0.6MPa - 0.8MPa | Thickness 1.2mm - 2.0mm |
Exchange Area | 0.8m² - 1.5m² | Exchange Efficiency > 90% | For split pressurized systems |
Magnesium Rod Spec | 230mm - 350mm | Consumption Cycle 18 - 24 months | Protects tank from corrosion |
The improvement of energy storage efficiency also requires coordination with intelligent control systems; sensors feedback the temperature difference between the upper-middle part of the water tank and the collector to the processor in real-time.
When the temperature difference reaches the set value (usually 5°C to 8°C), the circulating pump starts with a flow rate of 5 to 12 liters per minute.
This precise differential temperature control mode allows the annual Solar Fraction of the system to stabilize at over 75%.
Industrial Application
In the industrial field, large-area concentrating mirror fields focus light onto a receiver tower, generating high-pressure steam sufficient to drive 100 MW scale generator sets.
A large concentrating project commissioned in 2022 uses molten salt as the heat storage medium. Molten salt maintains extremely high chemical stability even at high temperatures of 565°C.
This molten salt energy storage system can provide up to 15 hours of full-power generation capability, solving the problem of energy output interruption after sunset.
In broader industrial washing and textile processes, collection fields providing hot water from 80°C to 120°C can reduce annual natural gas consumption by more than 40%.
Statistics for 120 factory samples show that installing each square meter of collection area produces an average of 800 kWh to 1100 kWh of heat per year.
This high-density thermal output shortens the investment payback period of industrial projects to between 4.2 and 5.5 years.
Calculating Benefits
The initial installation cost for a standard solar thermal system for a family of three is between $2,500 and $4,500, depending on the roof structure.
Based on energy price fluctuation data over the past 20 years, the thermal energy value generated by the system over its 25-year lifecycle is equivalent to $12,000 in electricity costs.
In areas with average sunshine exceeding 1,800 hours, every $1 invested in a solar thermal system eventually yields about $4.8 in energy returns.
· Monthly Savings: Can reduce total household electricity costs by 25% to 35% (for households with high hot water consumption).
· O&M Expenditure: About $50 per year, mainly for checking valve pressure and replacing consumable magnesium rods.
· Internal Rate of Return: Without considering government subsidies, the IRR typically falls between 14.5% and 19.2%.
· Asset Value Increase: Properties with high-efficiency solar thermal systems installed typically have a market valuation 3% to 4.5% higher than similar properties.
This long-term financial return is built on the extremely low failure rate of the equipment, thanks to the mechanical simplification of the system structure.
Compared to complex mechanical equipment, collectors have no moving parts. Aging is mainly concentrated in the natural degradation of sealing strips and insulation cotton.
This slow physical wear process determines that the system can continuously and stably output thermal energy until the end of its service life.
Quite Durable
The outer casing of solar collectors is mostly made of anodized aluminum alloy or stainless steel, with a thickness of over 1.2 mm to withstand gusts of 45 meters per second.
Under ISO 9,806 international standard pressure tests, the internal pipelines of the collector must withstand a sustained load of 1.5 times the working pressure without leakage.
Through tracking 10,000 long-term operation cases, collectors using all-copper flow channels showed a heat conversion efficiency drop of less than 4.5% after 25 years of service.
Durability Test | Test Standard | Test Result | Operation Guarantee |
Mechanical Load | 2400 Pa - 5400 Pa | No deformation or micro-cracks | Handles snow and wind pressure |
Salt Mist Corrosion | 1000-hour test | Grade 9 or above | Suitable for coastal environments |
Thermal Shock | 200 cycles (-40℃ to 90℃) | No glass breakage / intact welds | Handles extreme weather |
Impact Resistance | 25 mm hail (23 m/s) | No physical damage to surface | Protects core collection layer |
The robustness of the collector determines its popularity potential across different geographic environments, from high-altitude frigid regions to high-humidity coastal zones.
Even in highly corrosive environments, by adding a 20-micron thick anti-corrosion coating, the system can still maintain structural integrity for over 30 years.
This extremely long service life ensures that solar thermal utilization is not only a clean choice but also a highly resilient basic energy solution.
Passive Solar
How to Orient
The orientation of a house determines its annual light capture efficiency. In the Northern Hemisphere, it is generally required that the long axis be arranged along the east-west direction, ensuring that the main living spaces face true south within 15 degrees.
According to 2023 measurement data for 500 passive houses, south-facing windows can contribute about 60% to 85% of the entire building's heating load in winter.
This layout allows the interior to maintain daytime temperature rises using short-wave solar radiation without consuming a single kilowatt-hour of electricity, providing a solid foundation for subsequent heat storage.
Research samples show that when the building's southward offset angle exceeds 30 degrees, the solar radiation captured in winter will drop by about 20% to 25%. Ideally, the south-facing glass area should account for 7% to 12% of the building's total floor area to achieve a balance between heat gain and heat dissipation. In 2024, high-performance housing standards, this ratio is precisely calculated to prevent indoor overheating in summer.
Hidden in the Walls
Indoor heat absorbers usually use high-density concrete, masonry, or water-filled walls, which can absorb excess radiant heat and slowly release it after sunset.
Based on monitoring of 200 thermal mass experimental samples, heavy interior walls with a thickness of 10 cm to 15 cm provide the optimal delayed heat conduction effect, postponing heat release by 8 to 12 hours.
This heat storage mechanism ensures that indoor temperatures remain in a comfortable range of 18°C to 22°C late at night, reducing the frequency of nighttime heating equipment operation.
Experimental data proves that each square meter of south-facing glass needs to be matched with about 150 kg to 250 kg of heat storage material to avoid overheating. In rooms with high thermal capacity materials, the day-night temperature difference is usually compressed within 5 degrees, far superior to the 15-degree fluctuation of lightweight wooden structures. A 2022 thermal imaging comparison showed that heat storage floors can maintain a stable surface temperature of 28°C after four hours of direct sunlight.
Although heat storage materials solve the warming problem in winter, if there is no physical shading of the light entering the room during strong summer sunlight, the heat storage body will instead become a massive heat source.
Blocking the Sunlight
Rational shading design utilizes the characteristic of higher solar altitude angles in summer to block excess heat through fixed eaves, preventing a greenhouse effect indoors.
In a 40°N latitude region, designing a shading eave with a length of 25% of the window height can block about 70% of direct summer radiation from entering the room.
This physical-level energy filtering, combined with low-emissivity (Low-E) coated glass, can reduce the summer cooling load by about 45% to 60%.
Monitoring records show that test groups with automatically tracking sunshades installed had peak summer indoor temperatures about 6 to 9 degrees lower than the control group.
Using triple-paned glass with a U-value below 1.2 W/(m²·K) can block over 90% of far-infrared heat conduction.
A 2023 building energy efficiency survey pointed out that the payback period for passive shading systems is usually only 3.5 years, offering extremely high economic benefits.
While effective shading and insulation control heat flow, to maintain indoor air freshness, the system must drive airflow circulation through natural physical pressure differences.
Airflow Dynamics
Passive ventilation utilizes the stack effect of rising hot air, achieving air exchange of more than 0.5 times per hour without fans through pressure differences formed by high and low window openings.
According to wind speed measurements of 150 passive office spaces, when the temperature difference between indoors and outdoors reaches 5 degrees, the airflow speed in the ventilation ducts can be maintained at 0.2 m/s to 0.5 m/s.
This continuous natural convection not only carries away indoor CO2 but also cools the heat storage walls by 4 to 6 degrees through nighttime cold air breezes in summer.
In buildings with a depth of more than 15 meters, setting up a lighting atrium can improve natural ventilation efficiency by more than 30%.
Experiments show that underground cold air pipes pre-cooling air entering the room can drop daytime indoor temperatures in summer by about 3 to 5 degrees.
An airflow dynamics report released in 2024 confirmed that rational window opening designs can reduce mechanical ventilation electricity consumption by about 20%.
This application of aerodynamics significantly improves the physical comfort of living, and the long-term maintenance of this performance directly translates into property holding value and reduced maintenance costs.
How Much Is Saved?
Buildings adopting a full set of passive designs have lifecycle energy expenditures 75% to 90% lower than conventional buildings, with annual heating electricity per square meter usually below 15 kWh.
Based on market transaction data over the past 10 years, properties with high-performance passive energy-saving certification typically have market valuations 12% to 18% higher than similar ordinary properties.
Although initial construction costs increase the budget by about 5% to 10%, the extra costs are usually fully recovered within 7 years through saved electricity and maintenance fees.
In a follow-up survey of 1,000 households, the average monthly energy expenditure for passive houses was only $45.
Over a long operating cycle of 25 years, such houses can save a total of about $35,000 in fossil energy expenditures.
Industry trend forecasts for 2025 show that for every 10% increase in energy prices, the financial internal rate of return for passive design will increase by about 2.2%.
Extremely low operating expenses not only improve the homeowner's cash flow but also reduce the building's dependence on mechanical equipment, allowing the whole house to show stronger vitality when facing extreme climates.
Quite Durable
Since passive systems have no motors, water pumps, or complex electronic controllers, the service life of their physical structure is usually consistent with the main building, reaching over 50 years.
By testing older passive houses built 30 years ago, the performance degradation rate of their heat storage materials was found to be less than 2% over 30 years, and the insulation layer still maintained 95% of its initial performance.
This extremely high reliability means homeowners do not need to pay expensive annual air conditioning maintenance fees or replace compressors; annual maintenance costs are nearly zero.
According to feedback statistics from 12,000 long-term residents, the tranquility brought by passive design increased living satisfaction by 40%.
High-standard sealing technology reduces indoor dust levels by about 65% compared to ordinary houses, extending the service life of interior decorations.
After undergoing 100,000 hours of natural operation, the structural integrity score of this type of system remains at a high level above 0.92.