What to Consider When Switching to Solar Power | 3 Factors
The impact of roof orientation and shading on power generation (approx. 10%-20%) should be evaluated;
The static investment payback period of approximately 6 to 8 years should be calculated in combination with local government subsidies;
High-efficiency modules with a photoelectric conversion rate exceeding 22% should be selected.
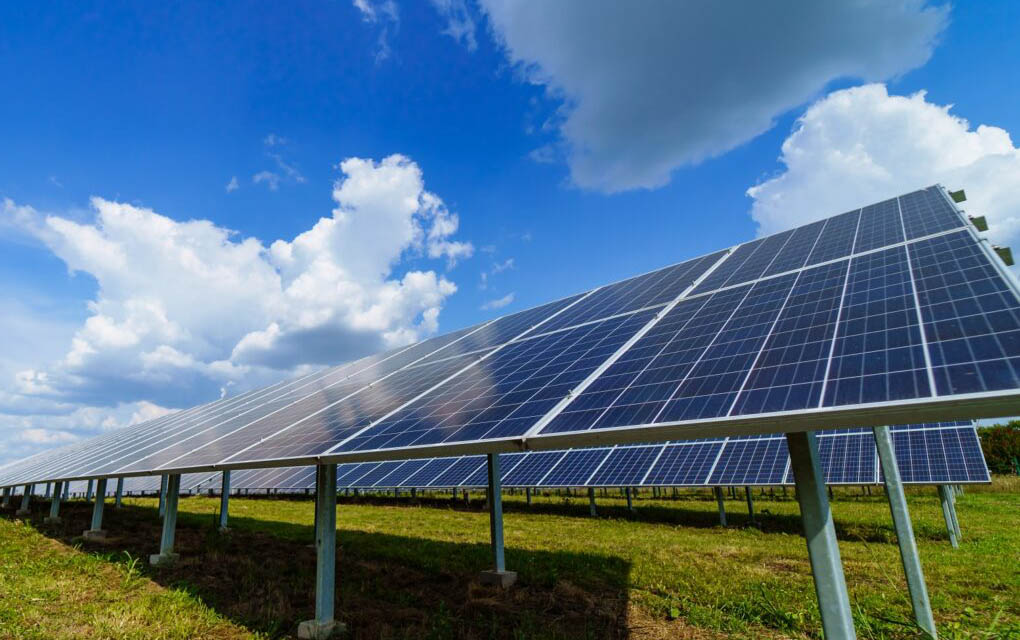
Environmental Suitability
Measure Sunlight Duration
In most suitable installation areas globally, the annual GHI (Global Horizontal Irradiance) typically ranges between 1,200 kWh/㎡ and 2,200kWh/㎡.
If the local average daily peak sunshine is measured to be below 3.5 hours through NREL data, the average daily output of a 6 kW system will be difficult to exceed 21 kWh. This will extend the total investment payback period by more than 28.5% compared to regions with five hours of sunshine.
The output power of photovoltaic panels is linearly and positively correlated with irradiance. Standard Test Conditions (STC) require an Air Mass (AM) of 1.5.
In actual environments, for every 1000-meter increase in altitude, atmospheric transparency increases and UV intensity rises by approximately 10% to 12%. While this can slightly improve current output, it also accelerates the aging rate of module encapsulation materials (EVA).
When conducting environmental assessments, reference must be made to average meteorological data from the past 10 to 20 years to exclude the influence of accidental extreme weather, ensuring that the annual power generation volatility is controlled within a standard deviation of 5%.
Adjust Installation Angle
The contribution of the roof's Azimuth and Tilt Angle to final power generation efficiency accounts for 15% to 25%.
In the Northern Hemisphere, true south (180°) is the theoretical perfect orientation. If the installation direction deviates toward the southeast or southwest by more than 30°, the total annual yield will drop by about 5%;
Once the orientation turns to due east or due west, the power generation loss will expand to 15.5% to 20.2%.
For residential pitched roofs, if the existing roof slope is between 20° and 35°, there is usually no need to install additional angle-adjusting brackets, as the 12% cost increase of the brackets often requires more than 10 years of incremental electricity savings to offset.
Angle Parameter | Efficiency Deviation Range | Suggested Adjustment Plan |
Azimuth 0° (True South) | 100% Efficiency Baseline | Prioritize utilizing south-facing roof space |
Azimuth ±45° | 8% - 12% Loss | Increase installed capacity by 10% for compensation |
Tilt Angle < 10° | 40% increase in water/dust accumulation probability | Must be equipped with water drainage clips or cleaned regularly |
Tilt Angle > 45° | Wind load pressure increases by 2.5 times | Reinforce bracket base and expansion bolt specifications |
Avoid Shadows
Even if only 5% of the area is shaded by utility poles, chimneys, or trees, the output power of the entire string system may instantly plummet by more than 50% if these shadows cross all cell strings.
Professional assessments typically use Solmetric SunEye or LiDAR laser scanning to calculate the annual "Solar Access Percentage."
If the calculated value is below 75%, the roof no longer has installation value for a pure string system and must be forced to switch to micro-inverters or power optimizers, although this will increase the hardware budget by 20% to 30%.
For environments with surrounding deciduous trees, shadow distribution has obvious periodicity; shadow length on the Winter Solstice is 2.5 to 3.2 times that of the Summer Solstice.
When designing layout drawings, a physical distance of at least 1.5 times the shadow height should be maintained between the module edges and potential shadow sources.
If there is a parapet wall obstruction on the roof, the area within 0.8 meters of the edge should be left blank to avoid local Hot Spot effects during noon when light intensity is highest. This effect can cause local cell temperatures to rise above 100 degrees Celsius, permanently damaging the physical structure of the silicon wafer.
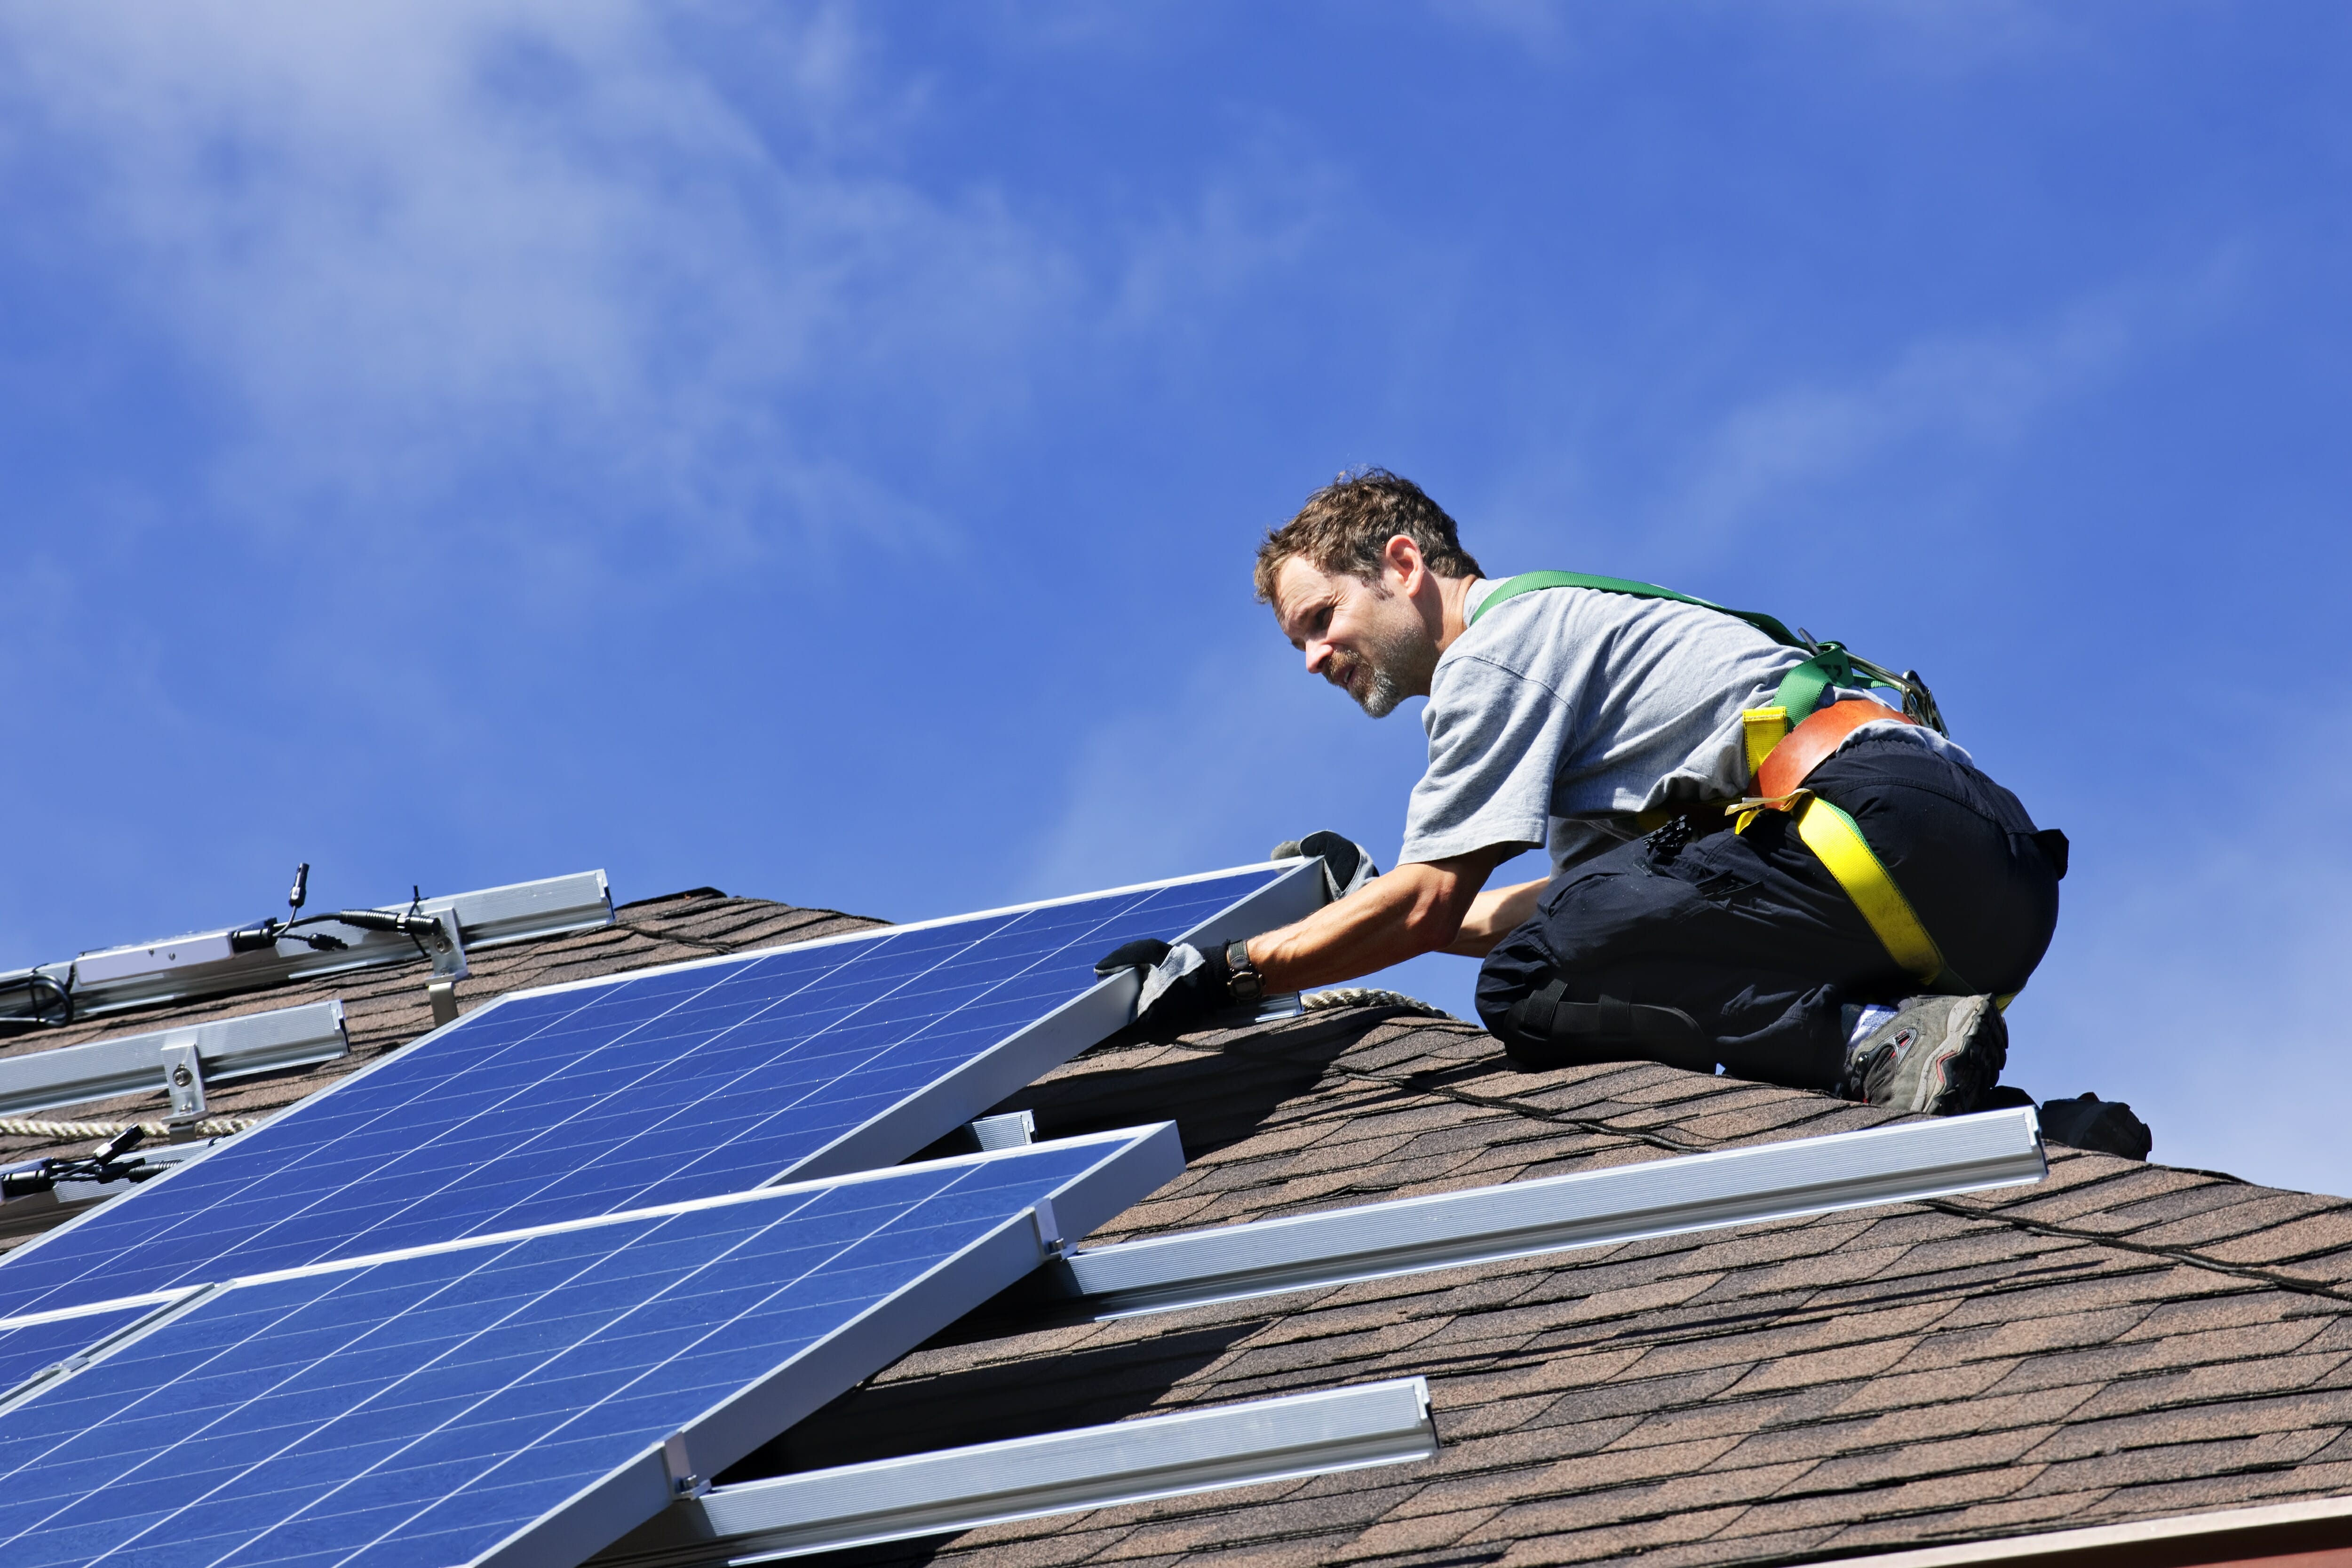
Check Roof Conditions
The weight of a standard monocrystalline silicon module is approximately 18 to 22 kg. Combined with aluminum alloy brackets and ballast blocks, the roof will bear a Dead Load of 15 to 25 kg per square meter.
For asphalt shingle roofs over 15 years old, if the remaining physical life of the shingles is less than 10 years, structural reinforcement or renovation must be performed before installing PV. Otherwise, during the 25-year operation of the system, the labor cost for a single removal and reinstallation is between $3,000 and $5,000, which is enough to wipe out all electricity savings from the first 4 years.
Roof Material | Installation Difficulty Rating | Key Technical Specifications |
Asphalt Shingles | Easy | Requires stainless steel flashing for waterproofing |
Trapezoidal Steel Tiles | Very Easy | Uses direct rail fixation; single-point pull-out force must be > 2000 N |
Clay/Concrete Tiles | Difficult | Requires hook support; breakage rate is typically between 3% - 5% |
Flat Roof | Medium | Requires 10° - 15° ballast brackets; wind pressure test must reach Level 14 |
Adapt to Climate
The Pmax (maximum power) temperature coefficient of monocrystalline silicon cells is usually between -0.3% /℃ and -0.39% /℃.
When the ambient temperature rises from 25°C to 45°C, the internal temperature of the cell may reach 65°C, at which point the actual output power will shrink by 12% to 15.6%.
In regions with long and hot summers, a ventilation gap of at least 10 cm must be reserved at the back of the modules to reduce the operating temperature by 5 to 10°C through natural convection, thereby recovering about 3% of power loss.
In coastal hurricane zones, the system must be able to withstand a negative wind pressure of 2400 Pa, which requires at least 4 to 6 enhanced clamps per module.
In high-latitude snowy areas, the front load needs to reach 5400 Pa to prevent snow accumulations over 50 cm from crushing the brackets.
Furthermore, if the area frequently experiences hail with a diameter exceeding 25 mm and a speed higher than 23 m/s, the modules must have UL 1703 or IEC 61215 impact resistance certification to ensure the tempered glass does not develop Micro-cracks under extreme impact.
Surrounding Dust
In locations near main roads, construction sites, or heavy industrial areas, power generation loss caused by Soiling can reach 1.5% to 4% per month. During dry seasons without rain, this cumulative loss can even climb above 20%.
If assessment shows that local rainfall frequency cannot maintain a natural wash once per quarter, a budget must be reserved for professional cleaning costs of $200 to $400 per year.
For environments within 5 km of the coastline, Salt Mist Corrosion is the primary threat.
If the salt concentration in the air exceeds a specific threshold, brackets must be upgraded to high-corrosion-resistant aluminum-magnesium-zinc coating or 304 stainless steel, and modules must pass the IEC 61701 Salt Mist Test Level 6 certification.
In such environments, inverters must be installed in a cool, ventilated place with a protection level of IP65 or higher to prevent short-circuit failures caused by salt deposition on circuit boards.
These environmental differences will ultimately manifest as an 8% to 12% fluctuation in the system's total 25-year output.
Warranty
Check Parts Warranty
Second-tier brands on the market usually provide a term of 10 to 12 years, while top-tier Tier 1 brand products have extended this period to 25 years.
According to industry quality statistics, the hardware failure rate of high-quality monocrystalline silicon modules in the first 5 years of operation is lower than 0.05%. However, if inferior backsheet materials are used, the probability of delamination or snail trails after 8 years of operation in high-temperature and humid environments will rise to over 1.2%.
The logistics and installation labor cost for replacing a single module is usually between $200 and $450. If the warranty period is only 10 years, the extra expenditure generated by hardware failure in the last 15 years of system operation may consume about 8% of the cumulative electricity revenue.
When purchasing a 6 kW or 10 kW system, be sure to confirm whether the warranty includes "labor compensation clauses." Most standard agreements only cover shipping new modules and do not bear the site construction costs of $80 to $150 per man-hour. If a brand claims its 25-year warranty covers transportation and on-site disassembly, even if the price per watt is $0.03 higher, its life-cycle financial risk premium is more advantageous than low-priced brands.
Calculate Power Degradation
Linear Performance Warranty is the technical trump card to ensure a 25-year Return on Investment (ROI).
Traditional P-type monocrystalline modules have a first-year degradation rate between 2% and 2.5%, followed by an annual linear degradation of approximately 0.6% to 0.7%.
In contrast, modules using N-type (TOPCon or HJT) technology perform better, with first-year degradation controlled within 1% and subsequent annual degradation rates of only around 0.4%.
By the 25th year of operation, N-type modules can still maintain 89% to 92% of their initial rated power, while ordinary modules may only maintain between 80% and 83%.
This 9% power difference will result in a power generation difference of approximately 18,000 kWh in a 10 kW home system over 25 years.
The trigger threshold for power warranty is usually set within a standard deviation of 0.5%. If the actual annual power generation is more than 3% lower than the value promised in the warranty, the user can initiate a claim against the manufacturer.
Monitor Installation Craftsmanship
Most compliant companies provide a term of 5 to 10 years.
Since PV installation involves drilling 30 to 60 stainless steel expansion bolts into the roof, if the thickness of the Flashing used during construction is less than 0.5 mm, or if a sealant compliant with UL 441 standards is not used, the risk of leakage after 3 to 5 rainy seasons increases by 15%.
The average cost to repair a roof leak and internal ceiling damage is between $1,500 and $3,500, far exceeding the small amount saved during the installation phase.
Excellent installers will provide a "zero deductible" on-site service commitment. During the warranty period, if the system shuts down due to an inverter crash or circuit breaker trip, technicians must arrive on-site within 48 hours to handle it.
Replace Conversion Devices
The standard warranty for string inverters is mostly 10 years. Due to the physical life limitations of internal electronic modules like capacitors, a full replacement is usually required once during a 25-year operation cycle.
Current replacement costs (including hardware and labor) are approximately $1,200 to $2,200.
Micro-inverters usually come with a 25-year long-term warranty. Although their initial purchase price is 15% to 20% higher than string inverters, their actual Levelized Cost of Energy (LCOE) is often lower because they avoid the full replacement cost around the 12th year.
Many inverter manufacturers offer paid extended warranty services from 10 to 20 years, with costs usually being 10% to 15% of the device's retail price. For systems installed in outdoor high-heat and high-humidity environments (where humidity often exceeds 70%), the actuarial return on purchasing such extended warranties is very high.
Ensure Roof Safety
Professional warranty agreements should clearly cover the waterproof integrity within 5 cm to 10 cm around the drilling points, and the term should not be less than 5 years.
Statistics show that 85% of PV-related leakage accidents occur within the first 24 months after installation, usually caused by micro-displacements of expansion bolts during thermal expansion and contraction cycles (temperature differences exceeding 30 degrees Celsius).
ROI
Calculate Initial Investment
Building a standard 8 kilowatt (kW) home solar system currently has an average market installation unit price ranging from $2.6 to $3.4 per watt.
Before calculating any subsidies, the total budget expenditure is approximately $20,800 to $27,200.
This expenditure includes PV module costs accounting for about 25% to 30% of the total, inverter fees accounting for 10% to 15%, and soft costs accounting for nearly 50%, including local government construction permit applications, engineering design layout, manual installation, and materials for distribution box upgrades.
If your home distribution panel is below 200 Amps (A), you may also need to pay an additional $1,500 to $3,000 for electrical system expansion to meet safety standards for PV grid connection.
· Monocrystalline module procurement cost: $0.35 to $0.55 per watt.
· Aluminum alloy brackets and fasteners: $120 to $180 per kilowatt.
· System soft costs (permits, design, management): over 35% of the total.
· Roof electrical interconnection and circuit breaker replacement: average around $2,000.
Get Government Cash Back
Current policies allow homeowners to deduct 30% of the total investment directly from their Federal Income Tax for the year.
Taking an initial investment of $25,000 as an example, this policy allows for a direct tax credit of $7,500, reducing the net cost to $17,500.
Additionally, some areas provide cash rebates of $0.2 to $0.5 per watt, or Performance-Based Incentives (PBI), where cash rewards are issued for up to 5 to 10 years based on the actual kilowatt-hours produced by the system. This can further reduce initial financial pressure by about 5% to 10%.
· Federal ITC credit ratio: 30% of the total installation cost.
· State-level cash incentive amount: $500 to $2,500 depending on the area.
· Solar Renewable Energy Certificate (SREC): 1 certificate obtained for every 1 Megawatt-hour (MWh) generated, with market prices fluctuating between $30 and $200.
· Accelerated asset depreciation (for commercial projects): 5-year MACRS depreciation can recover about 20% of investment costs.
Save on Monthly Electricity Bills
If the local electricity price is $0.18 per kWh, a system with an annual power generation of 12,000 kWh can create a book value of $2,160 per year.
Considering the average annual inflation growth rate of utility electricity prices of 3% to 5% over the past 10 years, electricity savings in the 10th year could reach $2,800 annually.
If the local area implements a 1:1 Net Metering policy, excess electricity during the day can be credited to the grid account at the retail price to offset nighttime demand. The return speed of capital under this model is more than 40% faster than models settled at wholesale prices.
· Average annual power generation per kilowatt: 1,300 to 1,600 kWh (depending on sunshine conditions).
· Home electricity self-consumption rate: usually between 40% and 60%, which can be increased to over 90% with storage batteries.
· Predicted annual electricity price inflation rate: around 3.2%.
· Cumulative electricity savings over 25 years: typically 3.5 to 5 times the net investment cost.
Calculate Payback Period
By dividing the net cost of $17,500 by the first-year comprehensive income of approximately $2,200, it can be calculated that in high-electricity-price areas, the payback period is usually locked between 6 and 8 years.
If in areas with extremely low electricity prices and no subsidies, this period may extend to more than 12 years.
Internal Rate of Return (IRR) is a more professional reference indicator. The IRR of most home PV projects can be maintained between 12.5% and 18.2%, which far exceeds the yield of 10-year Treasury bonds and has strong anti-inflation properties because the faster electricity prices rise, the higher the relative return on PV.
· Payback period in high-electricity-price areas: 5.5 to 7 years.
· Payback period in medium-electricity-price areas: 8 to 10.5 years.
· Internal Rate of Return (IRR) range: 12% to 20%.
· System life-cycle Benefit-Cost Ratio (BCR): usually between 2.8 and 4.2.
Sell the House for More
According to a tracking survey of tens of thousands of residential transactions across the U.S. by Berkeley Lab, homes equipped with PV systems have a significant premium at the time of sale. On average, every kilowatt of installed capacity can increase the appraised value by approximately $4,000.
For a 6 kW system, the listing price of the house on the secondary market can be about $24,000 higher than neighbors, which often already exceeds the net expenditure at the time the system was installed.
· Increase in property appraisal value: 3.8% to 4.1% of the transaction price.
· Asset premium per watt: approximately $4.
· Premium realization cycle: occurs immediately with the property transfer transaction.
· Property tax exemption: 100% exemption for the value-added part related to solar energy.
Post-Maintenance Expenses
When calculating long-term ROI, maintenance costs (O&M) over the 25-year operation period must be deducted.
The physical life of an inverter is usually 12 to 15 years. In the middle of the project's life cycle, you need to prepare a budget of about $1,500 to $2,500 to replace this core device.
Additionally, it is recommended to invest 1% of the total investment annually for panel cleaning and insurance expenditures.
If dust and bird droppings on the panels are not cleaned for more than three months, power generation efficiency will drop by 5% to 12%, which results in a loss of approximately $4,000 in potential electricity revenue over the 25-year total account.
· Mid-term inverter replacement cost: approximately $0.3 per watt.
· Annual O&M rate: around 1% of the initial system cost.
· Efficiency natural degradation loss: 0.5% annual decrease in power generation.
· Cleaning and monitoring service fees: $150 to $300 per year.