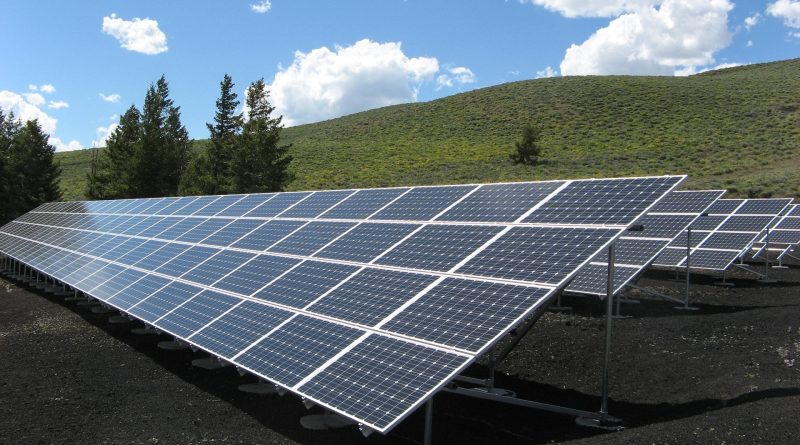
8 Advantages Of Solar PV Cells
Solar PV slashes emissions—IRENA notes 2.6B tons/year—and trims costs (89% drop since 2010), powers off-grid homes, needs minimal upkeep, lasts 25+ years, enhancing global energy access sustainably.
Free Power Once Installed
Consider the math: the average U.S. household consumes about 900 kWh per month. At a national average electricity rate of roughly 0.17perkWh,that′sarecurringmonthlybillofover150. A correctly sized solar array eliminates the vast majority of this cost for 25 to 30 years, the typical warranty period for most panels. The initial purchase is essentially a pre-payment for decades of electricity, locking in a low, stable energy rate and insulating you from utility price hikes that have historically increased at about 2.5% per year.
Once the installation is complete and the system is activated, the ongoing expense of generating power falls nearly to zero. The primary financial commitment shifts from a recurring monthly bill to a one-time capital investment. The energy production itself is fueled by sunlight, an abundant resource with no associated cost.
Most manufacturers guarantee that their panels will still produce at least 85% to 92% of their original rated power after 25 years of service. This degradation rate is remarkably slow, typically averaging only about 0.5% to 0.8% per year. This means a system rated for 10 kW at installation will still be producing approximately 8.5 kW or more a quarter-century later, with minimal decline in annual energy yield.
System Size | Annual Production (Sunny Region) | Annual Utility Savings (@ $0.25/kWh) | 25-Year Estimated Savings |
7 kW | 11,200 kWh | $2,800 | $70,000 |
10 kW | 16,000 kWh | $4,000 | $100,000 |
12 kW | 19,200 kWh | $4,800 | $120,000 |
The key to maximizing "free power" is proper system sizing. A system that meets 100% of your annual energy consumption effectively neutralizes your electricity bill, aside from minor fixed connection fees from the utility.
Due to manufacturing efficiency gains, the EPBT for silicon-based panels is now remarkably short, often between 6 months to 2 years, depending on the panel type and location. This means over its 30+ year life, a solar panel generates 15 to 60 times the energy needed to create it. With no moving parts, maintenance is straightforward. Inverter replacement is the most significant potential future cost; however, modern microinverters often come with 25-year warranties, matching the panel warranty period and ensuring decades of reliable, free power generation with very little required intervention.
Lower Your Electricity Bills
For most homeowners, the decision to go solar is driven by a straightforward, powerful goal: significant and immediate reduction in your monthly electricity bill. Unlike other home improvements, solar power delivers a direct, measurable financial return from the very first day it's operational. The mechanism is simple: every kilowatt-hour (kWh) of electricity your solar panels produce is a kWh you don't have to buy from your utility company.
Your utility meter slows down dramatically, and during periods of high production—like a sunny afternoon—your system will likely generate more power than your home is using. This surplus energy is then fed back into the grid, a process managed by a policy called net metering. Under net metering, your utility company provides you with a credit for this exported power, typically at the same retail rate they charge you. These credits are then used to offset the cost of electricity you draw from the grid at night or on cloudy days. The annual savings are directly tied to your local utility's electricity rate; the higher the rate, the faster your solar investment pays for itself. For example, in states like California and New York, where rates are often 0.25−0.35 per kWh, the payback period for a solar investment can be as short as 5 to 7 years.
The financial performance is best illustrated with real numbers. Consider a household with a consistent monthly consumption of 1,000 kWh facing an electricity rate of $0.25/kWh.
Scenario | Monthly Grid Consumption | Monthly Solar Production | Net Grid Purchase | Monthly Electric Bill | Monthly Savings |
Without Solar | 1,000 kWh | 0 kWh | 1,000 kWh | $250 | $0 |
With 100% Offset Solar | 1,000 kWh | 1,000 kWh | ~0 kWh | ~$15 (fee) | $235 |
In winter, with shorter days, you will draw down those credits. The goal of a well-designed system is to have your annual production credits equal your annual consumption costs, resulting in a 0ornear−0 net bill over a 12-month cycle. The long-term savings are substantial. Assuming a conservative utility inflation rate of 2.5% per year, a system that saves you 1,800 inits first year will save you approximately 2,300 in its tenth year, simply because grid power becomes more expensive while your solar cost remains fixed. Over the 25-year warranty period of the panels, this compounds into total savings often exceeding 40,000 to 60,000, effectively paying for the system multiple times over.
Reduce Your Carbon Footprint
The average U.S. household is responsible for approximately 7.5 metric tons of carbon dioxide (CO2) emissions annually just from electricity use. This is equivalent to the emissions from burning over 8,000 pounds of coal.
The U.S. national average for carbon dioxide equivalent (CO2e) emissions is roughly 0.855 pounds of CO2e per kWh of grid electricity. This number varies significantly by region; in areas heavily reliant on coal, it can exceed 1.3 pounds per kWh, while in regions with more hydro or nuclear power, it may be lower. A typical 10 kW solar system producing 16,000 kWh annually will prevent the release of approximately 6.8 metric tons of CO2e each year. To put that into perspective, that annual reduction is equivalent to the carbon sequestered by 8.5 acres of U.S. forests in a single year or the emissions from driving an average gasoline-powered passenger vehicle for over 16,000 miles.
The lifetime impact is profound. Over a 25-year operational period, that single 10 kW system prevents over 170 metric tons of CO2e from entering the atmosphere. This is comparable to removing the emissions from 430,000 miles of driving or neutralizing the carbon footprint of over 20,000 gallons of gasoline consumed.
The reduction in these particulates translates to measurable public health benefits. The National Renewable Energy Laboratory (NREL) estimates that the adoption of solar and wind energy led to public health savings ranging from 2.7billionto9.8 billion in a single year due to avoided air pollution-related illnesses and premature deaths. The energy payback time for solar panels—the period it takes for a panel to generate the amount of energy required to manufacture it—has improved dramatically with technological advances. Modern silicon panels now recover their embodied energy in just 6 months to 2 years. This means that for over 90% of their 30-year lifespan, they are net producers of clean, carbon-free energy, operating at an emissions rate close to zero.
Works on Various Roof Types
In fact, the key factors are not the style itself, but the roof's structural integrity, available unshaded area, and age. A qualified installer will assess these elements to determine the optimal configuration, ensuring the system's weight—typically adding 2.5 to 4 pounds per square foot—is well within the safe load capacity of your roof's framing, which is usually designed to support a 20-30 pounds per square foot live load from snow alone.
While a pitch between 30 to 45 degrees is often considered optimal for annual production in mid-latitudes, panels on flatter (10-degree) or steeper (60-degree) roofs still perform with high efficiency, often experiencing a reduction of less than 10-15% compared to the ideal angle. For flat or very low-slope roofs (under 2:12 pitch), installers use weighted ballast systems that hold the array in place without penetrating the roof membrane, or they employ a slight tilt (around 5-10 degrees) to enhance rainwater runoff and energy capture.
The compatibility largely depends on the mounting hardware and flashing techniques used. Here’s a brief look at common scenarios:
·
Asphalt Shingles: This is the most straightforward and common installation. Installers use lag bolts that penetrate the shingles and sheathing to anchor directly into the roof rafters. Each penetration is sealed with a custom-fitted, corrosion-resistant metal flashing and a rubber gasket, creating a waterproof barrier that often exceeds the original roof's leak resistance. The mounting feet are then bolted to these anchors.
·
·
Tile Roofs (Clay or Concrete): Installation can be more labor-intensive but is entirely feasible. There are two primary methods: the "tile-and-rail" system, where specific tiles are removed and replaced with custom mounting brackets that align with the rafters, or the use of "s-style" hooks that clip directly onto the exposed tiles without removal, reducing the risk of breakage. Both methods add approximately 15-25% to the total installation time and cost compared to an asphalt shingle roof.
·
·
Metal Roofs (Standing Seam): These roofs are often ideal for solar. Clamp-based systems can be attached directly to the vertical seams without any penetrations whatsoever, preserving the roof's integrity. This method is faster, eliminates leak risks, and allows for easy panel removal for roof maintenance. The clamps are engineered to handle wind uplift forces exceeding 110 mph.
·
·
Flat Roofs: As mentioned, these use ballasted systems. The weight—usually concrete blocks or specialized plastic trays—is calculated to meet local wind load requirements without penetrating the roof. A key consideration is spacing: arrays are installed with a 4- to 6-inch gap above the roof surface to allow for air circulation, which prevents heat buildup that can reduce panel efficiency by 1-3%.
·
Low Maintenance and Durable
They are rigorously tested to survive direct impacts from 1-inch (25-mm) diameter hailstones traveling at 50 miles per hour and to resist wind loads equivalent to 140 mph gusts. This robustness is backed by two key warranties: a performance warranty that guarantees the panels will still produce at least 85-92% of their original power output after 25 years, and a materials warranty that typically covers defects for 10-12 years. This combination of passive operation and strong construction means your ongoing maintenance effort is close to zero, with annual upkeep costs often amounting to less than 0.2% of the system's initial price.
This assembly is designed to endure temperature cycles from -40°F to 185°F (-40°C to 85°C), UV radiation, and moisture for decades. The primary maintenance activity is occasional cleaning, but this is largely driven by your local environment. In regions with regular rainfall of 20 inches or more per year, the rain naturally cleans most dust and pollen off the angled panels. In arid, dusty climates, or if you're near a source of dirt like a farmland or a busy road, you might need a cleaning once or twice a year. This can be done with a soft brush and deionized water, often for a cost of 150−300 per service if hired professionally. The energy gain from cleaning is usually modest, on the order of 3-7%, but can be higher in exceptionally dirty conditions.
String inverters typically last 10-15 years and are a planned replacement cost, with prices around 0.15−0.25 per watt (or 1,500−2,500 for a 10kW system). The trend towards microinverters, which are installed under each panel and carry 25-year warranties, effectively eliminates this mid-life maintenance item.
Increases Your Property Value
Research from the U.S. Department of Energy's Lawrence Berkeley National Laboratory (LBNL) analyzed sales data across multiple states and found that, on average, homebuyers are willing to pay approximately 15,000 more for a home with a standard−sized solar photo voltaic(PV) system.This premium translatest oan averagein crease of 4.1500,000 home, that’s an added value of over $20,000.
Data suggests that the market value increase is roughly 3,000 to 4,000 per kilowatt (kW) of installed solar capacity. This means a 7.5 kW system could add between 22,500and30,000 to your home's appraised value. This appraisal method is now formalized in the industry; Fannie Mae guidelines explicitly permit appraisers to adjust the comparable sales value to account for solar installations, ensuring the value is officially recognized during a mortgage application.
A study by Zillow Group Economic Research, which analyzed sales data from millions of homes, concluded that properties with solar-energy systems sold for 4.1% more on average than comparable homes without solar power. For a median-valued home at the time, this equated to a premium of about $9,274.
A National Renewable Energy Laboratory (NREL) study found that homes with PV systems sell 20% faster than those without. Real estate listing data shows that listings that include terms like "photovoltaic," "solar panels," or "sun power" in their descriptions can attract significantly more views online. This is because a solar system directly addresses a modern homebuyer's key concerns: reducing their monthly operating costs and their environmental impact. A survey by the National Association of Realtors indicated that over 80% of home buyers consider heating and electricity costs important, and a system that eliminates the majority of the electric bill is a powerful selling point.
Silent Operation
Modern string inverters typically generate a soft hum at a level of approximately 20 to 30 decibels (dB) from a distance of one meter, which is quieter than a whisper or the background noise in a quiet library (30 dB). More importantly, when installed in a garage, basement, or on an exterior wall, this sound is almost always completely inaudible inside the home, as it is easily masked by the ambient noise level of a typical household, which averages around 40-50 dB.
These devices are typically rated to operate at less than 25 dB and are mounted outside, where environmental sounds like wind (30-50 dB), rustling leaves (20 dB), and distant traffic (70-80 dB) completely drown them out. The operational sound profile is so low that it has no impact on indoor or outdoor living spaces, making it an ideal solution for quiet residential neighborhoods where noise ordinances often restrict sounds above 45-55 dB during night-time hours.
Sound Source | Estimated Sound Pressure Level (Decibels, dB) | Perceived Loudness Compared to Solar Inverter |
Quiet Rural Ambient Sound | 20 dB | Similar |
Solar Microinverter (at 1 meter) | 20-25 dB | Reference |
Solar String Inverter (at 1 meter) | 25-35 dB | Slightly louder |
Refrigerator Hum | 40 dB | ~4x louder |
Normal Conversation | 60 dB | ~32x louder |
Gas-Powered Home Generator | 80-100 dB | ~1000x louder |
This means an increase of 10 dB is perceived as roughly twice as loud. The difference between a solar inverter's 25 dB and a generator's 85 dB is 60 dB, meaning the generator is perceived as 64 times louder. This profound difference underscores why solar power is uniquely suited for integration into residential environments where peace and quiet are valued attributes. The system's performance is also consistent; unlike mechanical systems whose noise can fluctuate with load, a solar inverter's sound output remains at a very low and steady frequency, typically between 50-60 Hz, which the human brain easily tunes out as background noise.
Supports Energy Independence
Instead of being a passive consumer subject to fluctuating market prices and centralized control, you become an active producer of your own power. This shift provides a significant buffer against the volatility of electricity costs. For example, between 2000 and 2022, the average U.S. residential electricity price rose from 0.08 to over0.17 per kWh, an increase of more than 112%. By generating your own electricity, you lock in a fixed cost for power for the 25-to-30-year lifespan of your system. For a household that consumes 12,000 kWh annually, this price instability represents a financial risk of thousands of dollars over a decade.
A system designed to offset 100% of your annual consumption can reduce your reliance on the grid by 90-95% on an annual basis, with the remaining 5-10% typically drawn at night. The financial impact of this is substantial. If your utility's rate increases by the historical average of 2.5% per year, a system that saves you 1,800 inits first year will save you approximately 2,300 in year 10 and over $2,900 in year 20, simply because the cost of grid power is escalating while your solar energy cost remains constant at nearly zero. This creates a powerful economic shield. Furthermore, with the addition of a solar cell storage system, like a 10 kWh Tesla Powerwall or LG Chem RESU, your independence can surge to nearly 100% during short grid outages and can power critical loads for 12 to 24 hours or more, depending on usage. This transforms your home into a resilient energy island during blackouts, which are increasing in frequency; the U.S. experienced a 78% increase in power outages from 2011 to 2021 compared to the previous decade.
System Configuration | Annual Grid Reliance Reduction | Protection Against Rate Hikes | Outage Resilience | Upfront Cost Multiplier (vs. Grid-Tied) |
Grid-Tied Solar (100% Offset) | 90-95% | High (For 90-95% of usage) | None (System shuts off during outage) | 1.0x |
Solar + 1 Cell (10 kWh) | 70-80% (Increased self-use) | Very High | 12-24 hours of backup for essentials | ~1.6x - 1.8x |
Solar + 2 Batteries (20 kWh) | 80-90% (Increased self-use) | Very High | 24-48 hours of backup for essentials | ~2.2x - 2.6x |
In fact, they are often exporting surplus energy. This reduces strain on the local transformers and power lines, decreasing the probability and duration of brownouts for everyone in the neighborhood. By reducing peak demand, a concentration of solar homes can delay or eliminate the need for the utility to invest $1-3 million in upgrading a local substation, costs that would otherwise be passed on to all ratepayers.