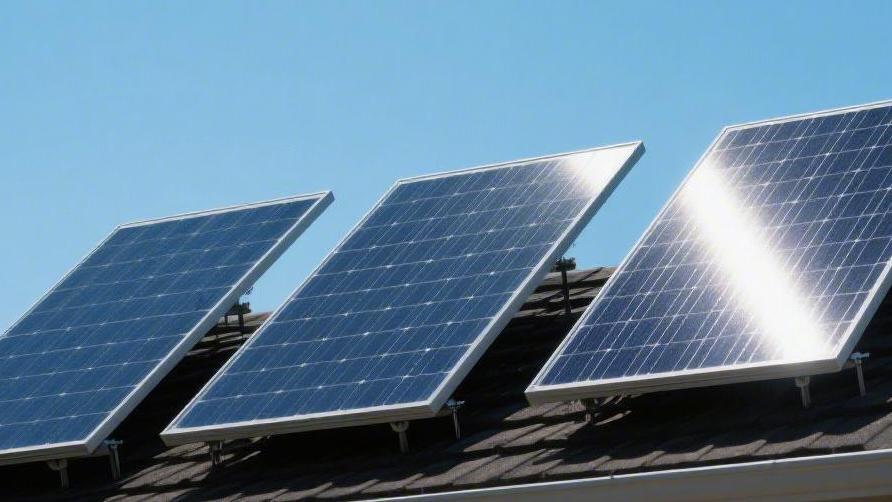
How to Maximize Solar Panel Efficiency | 3 Ways
First, face the panels due south and set an optimal tilt angle of 30 to 45 degrees;
Second, wash the surface dust with clean water every six months to recover about 20% of power generation loss;
ly, leave a gap of at least 10 cm at the bottom during installation for ventilation and heat dissipation.
Optimize Placement
Which Way to Face
In the Northern Hemisphere, setting the installation azimuth to 180 degrees due south captures 100% of the nominal radiation. A 15-degree azimuth deviation caused by roof structural constraints will result in a 3% loss in total annual power generation. When the panels face exactly east or west, deviating by 90 degrees, the overall power output drops by 20%. By using a solar pathfinder to collect 24/7 sunshine trajectory samples for 365 days a year, you can calculate the peak radiation window between 9 AM and 3 PM local time. Within this 6-hour window, the effective photon impact frequency per square meter of surface is highest, providing a radiation intensity of about 850 watts to 1050 watts. If your budget allows, equipping a single-axis tracking system to make the panels follow the sun's trajectory can extend the daily effective power generation time from 4.5 hours to 6.2 hours. Purchasing a tracking mount with a nominal load capacity of 500 kg requires an additional $2,500 cost. Relying on the 15% to 25% increase in power generation, and factoring in the 15-year depreciation cycle of the equipment, the levelized cost of energy (LCOE) will decrease by $0.02 per kWh.
l A 90-degree azimuth deviation causes a 20% drop in power output.
l The peak radiation window provides an intensity of 850 to 1,050 watts/sqm.
l A tracking system increases daily effective generation time to 6.2 hours.
l A $2,500 mount investment lowers the levelized cost of energy by $0.02.
Shading is a Huge Loss
A single leaf or a 5 cm diameter wire casting a shadow that covers less than 2% of a single panel's area at 12 PM noon will trigger the bypass diode due to the short-board effect of the photovoltaic cell series circuit, causing the output power of that loop to instantly drop by 30% to 50%. Use a drone equipped with LiDAR for 3D point cloud scanning to obtain the height and volume parameters of obstacles around the roof, establishing a shadow model with a standard deviation of less than 0.1 meters. Panel installation must be located in an area with zero probability of shading during the high luminous flux period from 10 AM to 2 PM. If there are moving shadows with a 5% duty cycle, the system topology must be switched to microinverters. Installing a $45 power optimizer on a module with a nominal voltage of 40 volts can recover 8% to 12% of the power loss caused by partial shading over a 25-year operating cycle, increasing the overall ROI by 1.5 percentage points.
l Obstacles within a 30-meter radius require a shadow model with a 0.1-meter standard deviation.
l A shadow covering 2% of the area triggers a 30% to 50% drop in loop power.
l A $45 optimizer investment recovers 8% to 12% of power loss.
l The full-lifecycle return on investment increases by 1.5 percentage points.
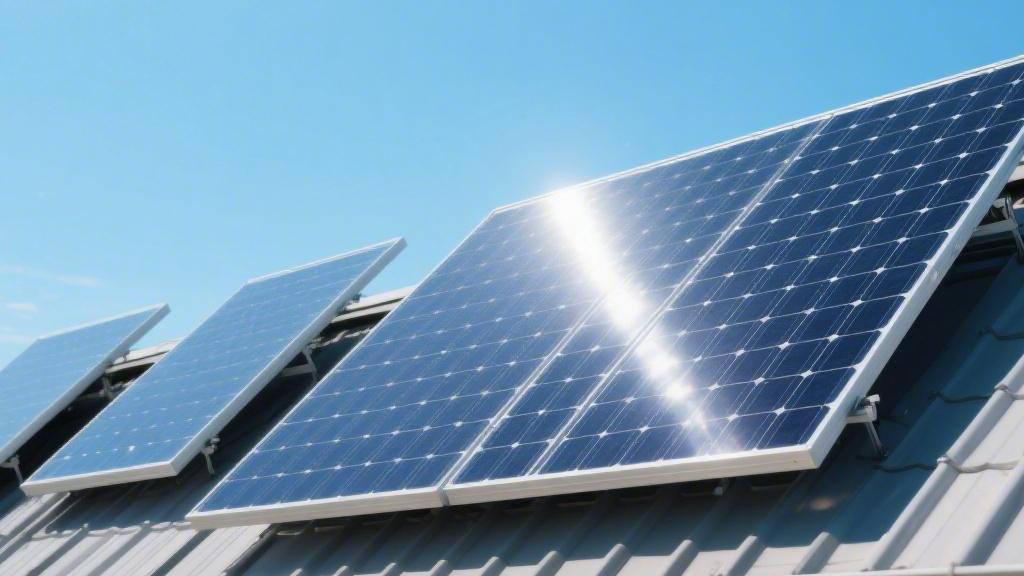
Space Out the Rows
When installing multiple rows of arrays on a flat roof, the calculation error for self-shading of the back row by the front row must be strictly controlled within 2%. Using the sunlight data at 12 PM noon on the winter solstice, which has the lowest solar elevation angle of the year, as the limit test parameter: assuming a latitude of 40 degrees, the winter solstice solar elevation angle is about 26.5 degrees, the panel tilt angle is set to 30 degrees, and the vertical height of the panel is 1 meter, the calculated minimum safe distance between the front and back rows must not be less than 2.2 meters. Shortening the spacing to 1.5 meters will cause the bottom 30% of the back-row modules to be in shadow during winter, generating severe current mismatch and causing a negative growth rate of up to 15% in total monthly power generation during winter. Increasing the row spacing will reduce the installed capacity on a single roof by 15%, but ensures all panels maintain full-load current output during low-sunlight months. Array spacing increases the surrounding air circulation volume; every 0.5 m/s increase in wind speed can carry away about 15 W/sqm of heat from the module surface, dropping the operating temperature by 2 to 3°C. Calculated at a temperature coefficient of -0.35%/°C, the overall photoelectric conversion efficiency can rebound by 1 percentage point.
l The calculation error for front-to-back row shading must be strictly controlled within 2%.
l An ultra-short 1.5-meter row spacing causes a 15% negative growth in monthly power generation.
l Increased ventilation carries away 15 W/sqm of surface heat.
l A temperature drop of 2 to 3°C boosts conversion efficiency by 1 percentage point.
Avoid Wind Zones
Panel installations must be at least 1.2 meters away from the eaves or roof ridge edges. According to fluid dynamics wind tunnel test data samples, the peak local wind pressure sustained at roof edges and corners is 1.5 to 2 times that of the central area. Encountering extreme weather with wind speeds exceeding 25 meters/second, the uplift load sustained by edge modules will break through the standard certification limit of 2400 Pascals, increasing the risk of mounting deformation and micro-cracks. Maintaining a 1.2-meter setback distance reduces the maximum wind pressure on the equipment by 40%, leaving a walkway width that complies with safety regulations for a single person carrying a 15 kg bucket of water for cleaning operations. Avoid roof exhaust fans and AC outdoor unit exhaust vents by a distance of at least 3 meters. When a 3 kW AC outdoor unit operates at full load in summer, the exhaust gas temperature is as high as 45°C, humidity is generally above 60%, and the heat wave jet speed reaches 4 meters per second. If photovoltaic panels fall within the distribution range of this hot air flow, the local ambient temperature will rapidly break through the 25°C median of standard test conditions, generating continuous thermal degradation and negatively impacting daily power yield by 4%.
l A 1.2-meter edge setback reduces the maximum wind pressure sustained by the equipment by 40%.
l Edge uplift loads exceed 2400 Pascals at wind speeds of 25 m/s.
l Avoid exhaust vents by 3 meters to prevent interference from 45°C exhaust gases.
l Exceeding the 25°C median temperature triggers a 4% daily power loss.
Capture Reflected Light
On a dark asphalt roof with a reflectivity of only 10%, the backside gain typically hovers between 2% and 3%. Investing $12 per square meter to replace the roof waterproofing layer with white TPO or EPDM polymer membranes can skyrocket the surface albedo value to 75% to 85%. Combined with a mounting ground clearance of 0.6 to 0.8 meters, this gives the diffused photons reflected from the ground ample physical space to refract onto the back of the modules, generating 15% to 20% additional current output. In a system with an installed capacity of 10 kW, changing the surface material's reflected light can generate about 1,800 extra kWh per year. At an average electricity rate of $0.15 per kWh, this recovers $270 in monetary gains annually. The shading rate of the module's back frame and crossbeams must be controlled below 5% to reduce the strip shadows cast by the mounting on the backsheet, making the photon distribution received on the back more uniform, minimizing the dispersion of back power output, and ensuring the comprehensive conversion efficiency of bifacial modules remains stable at a high parameter of 23%.
l A dark roof's 10% reflectivity provides only 2% to 3% backside gain.
l A $12/sqm investment increases surface albedo to 75% to 85%.
l A 0.6 to 0.8-meter ground clearance yields 15% to 20% extra output.
l A shading rate below 5% maintains a 23% comprehensive conversion efficiency for bifacial modules.
Cleaning and Maintenance
Wash Away the Dust
An accumulation of 0.2 mm of suspended particulate matter on the surface of silicon-based panels blocks photons in the 380 nm to 780 nm visible light spectrum from penetrating the glass coating, causing the short-circuit current data of the test string to show an 8% to 15% linear decline within 4 weeks. Washing with hard water will leave calcium carbonate crystals on the glass surface; the mineral salt film with a refractive index of 1.6 secondarily reflects incident light, causing an irreversible 2.5% loss in overall photoelectric conversion efficiency. Hire a professional team for $150 to $200 per session to perform a physical wash using pure water with a TDS (Total Dissolved Solids) below 200 ppm and a pH between 6.5 and 8.5.
Applying a fluid pressure of 0.4 to 0.5 MPa, combined with a nylon soft-bristle roller brush rotating at 300 RPM, will strip away 98% of adhered dirt. A single operation consumes about 1.5 to 2 liters of water per square meter and should be performed when the surface temperature is at a median of 20°C to 25°C in the early morning to prevent the glass from shattering due to thermal stress caused by a temperature difference exceeding 40°C during peak sunlight. The cleaning frequency is set to 2 to 3 cycles per year, dynamically adjusted based on PM10 concentration peaks during sandstorms or agricultural harvesting seasons. An annual budget of $300 on a 10 kW capacity system can recover 1,200 kWh of electricity lost to dust shading. Calculated at $0.12 per kWh, the ROI reaches a staggering 48%.
An adhesion of 0.2 mm of particulate matter drops the short-circuit current by 15%. Washing with pure water below 200 ppm TDS at 0.4 MPa pressure yields a 48% excess return rate on a single $150 investment.
Check for Damage
Monocrystalline silicon cells are typically between 160 and 180 microns thick. After sustaining wind loads or hail impacts, micro-cracks at the micrometer level form internally. These mechanically invisible damages cut off the transmission paths of photoelectrons, causing the open-circuit voltage of a single 1.6-square-meter module to drop from 38 volts to 34 volts. Rent an infrared thermal imager for $150 a day, with a pixel resolution of 640x512, and set the emissivity parameter for glass material at 0.85. Identify abnormal hot spots with temperatures more than 5°C higher than the surrounding normal areas. A localized high-temperature zone exceeding 85°C for 3 consecutive seconds will burn through the backsheet polymer material within 6 months.
Record the resistance values of the bypass diodes inside all junction boxes. Normal reverse resistance should be in the megohm range; if a resistance below 100 kilohms is measured, it indicates the module has been broken down by lightning overvoltage. Conduct an open-circuit voltage test on the system every 12 months, controlling the voltage deviation of the 30-panel series loop within a 2% standard deviation. Spending $50 to replace a DC cable with aging and peeling insulation can cut off 10 mA to 30 mA of ground leakage current, pushing the probability of unplanned system downtime down from 5% to below 0.1%.
A 160-micron cell micro-crack causes a 4-volt drop in open-circuit voltage. Infrared scanning detects hot spots above 5°C, and a $50 cable replacement cost reduces the system downtime probability to 0.1%.
Clear the Snow
A 5 cm thick layer of dry snow covering the panels drops light transmittance to almost zero, instantly plunging the instantaneous output power of the entire module set to below 1% of its nominal capacity. Wet snow with a 20% water content increases in density, generating a static mechanical load of about 30 kg per square meter on an array with a 30-degree tilt, approaching the 2400-Pascal deformation yield limit of the aluminum alloy frame. When temperatures fall below -10°C, melted snow water freezes again at the bottom frame of the module, and the ice expands 9% in volume, generating outward compressive stress that destroys the waterproof performance of the silicone seal. This causes moisture to penetrate the EVA film and triggers electrochemical corrosion of the electrode grid. Purchase a 5-meter telescopic snow rake with a soft polyurethane foam blade, costing about $45, with a friction coefficient controlled below 0.2 to avoid leaving scratches on the glass surface with an anti-reflective coating.
Clear 80% of the surface snow layer before sunrise, relying on the diffused light passing through the remaining 20% snow layer to start the inverter. The Joule heat generated by the internal working current of the modules will raise the glass surface temperature by 3 to 5°C, and the remaining snow will slide off on its own along the 30-degree slope due to physical gravity. This combined snow removal method of physical intervention and thermodynamic effects can snatch back an extra 3.5 hours of effective daily power generation time, converting to electricity equivalent to about 12% of the system's capacity.
A 5 cm snow accumulation drops output power to zero. A $45 polyurethane soft-blade snow rake clears 80% of the snow layer, relying on a 3°C module temperature rise to melt the remaining snow and reclaim a 3.5-hour generation cycle.
Keep Birds Away
Bird droppings contain a high concentration of uric acid, with a pH consistently in the highly acidic range of 3 to 4. If they adhere to the module surface for more than 72 hours, they will deeply corrode the approximately 100 nm thick silicon dioxide anti-reflective coating. A piece of dried bird feces just 3 cm in diameter causes a localized short circuit in the cell, triggering a severe hot spot effect. Because the current is blocked, generating high electrical resistance heating, the temperature in this area will spike to an extreme 150°C within 20 minutes. The high temperature rapidly melts the EVA film and scorches the backsheet, resulting in the total ruin of a single $250 solar panel. Birds like to nest in the bottom gaps of modules 0.1 to 0.2 meters off the ground. The accumulation of dry branches and feathers reduces the rear air convection cross-sectional area by 80% and raises the bottom ambient temperature by 10°C, causing overall conversion efficiency to drop by 3.5%.
Spend $200 to procure a 30-meter long PVC-coated galvanized steel wire mesh with a 12 mm mesh diameter, and use dedicated nylon cable ties to create a 360-degree fully enclosed physical barrier along the outer frame of the array. Mechanical protection methods intercept 99% of bird invasion probability and prevent small animals from chewing on the 4 mm diameter DC cable insulation. This one-time investment taking up 1.5% of the total system budget extends the lifecycle of the entire cable and connector set by about 10 years.
Bird droppings with a pH of 3 to 4 corrode the 100 nm anti-reflective coating, triggering 150°C hot spots. A $200 fully enclosed PVC steel wire mesh isolation increases the cable lifecycle by 10 years.
Check the Readings
The inverter's built-in data acquisition stick uploads operating parameters across more than 50 dimensions, including DC voltage, AC current, active power, and ambient temperature, to the cloud server at a 15-minute sampling frequency. Extract a time-series sample of over 35,000 continuous data points over 12 months to build a Gaussian distribution power generation prediction model. Set a 95% confidence interval; when the average daily power generation for a specific week falls below the prediction's lower limit by more than 5 percentage points, a level 2 fault alarm is immediately triggered. Compare the current difference between the two parallel MPPT (Maximum Power Point Tracking) channel inputs. If the deviation exceeds 0.5 amps, it indicates one of the branches has a blown fuse or a contact resistance above 100 milliohms caused by MC4 terminal oxidation.
Download the baseline curve of the module's 2% first-year degradation rate and the subsequent 0.55% linear annual loss rate, and overlay the monthly median of the actual output for comparison. If the measured power curve in the 5th year is 2.5% lower than the theoretical value, check for derated operation caused by dust accumulation on the inverter cooling fan. Spending $30 to replace the DC cooling fan with a 4000 RPM model restores the inverter's 98% conversion efficiency, avoiding a daily loss of 0.5 kWh and locking in an internal rate of return (IRR) of over 11% at its peak level for the system's 25-year lifecycle.
A 15-minute sampling frequency extracts 35,000 data points to build a model, troubleshooting a 0.5 amp current deviation. Replacing a 4000 RPM fan for $30 locks in an IRR of over 11%.
Upgrade to Microinverters
Separate the Connections
Traditional string inverters connect 10 to 15 solar panels with a nominal power of 400 watts into a single high-voltage DC loop.
When about 30 grams of bird droppings adhere to the surface of a single module, covering an area of 0.01 square meters, the output current of that module will plummet from a peak of 10.8 amps to 7.5 amps.
Constrained by the short-board effect of a series circuit, the working current of the other 14 normally operating panels on the entire loop will be forcibly pulled down to the same 7.5-amp level.
This amplification of physical property dispersion will cause the overall output power of the string to plummet from the expected 6000 watts to 4200 watts, instantly producing a severe 30% power loss.
Adopting a microinverter architecture, each solar panel is independently connected to a conversion module with a volume of about 1.5 liters and a weight between 1.5 kg and 2 kg.
The system's total DC voltage, originally as high as 400 to 600 volts, is physically divided and restricted within the 60-volt safe protection boundary of a single module.
Each microinverter provides a standard residential voltage of 120 volts or 240 volts at the AC output end, with a frequency stabilized at 60 Hertz and voltage fluctuation variance strictly controlled within 0.5 volts.
The maximum continuous output current of a single device is typically set between 1.15 amps and 1.45 amps, completely eliminating the 15% statistical probability of roof fires caused by high-voltage DC arcing.
Ignore Shading
The built-in high-frequency digital signal processor operates the MPPT (Maximum Power Point Tracking) algorithm for a single panel independently at a sampling rate of 100 times per second.
For a photovoltaic array disturbed by the moving shadows of a tree canopy, the solar flux of a single panel will show irregular high-frequency fluctuations from 0 to 1,000 W/sqm.
The microinverter can accurately capture the peak product of maximum voltage and current within every millisecond with a static MPPT tracking accuracy of 99.8%.
Its lower startup voltage limit is only 22 volts, whereas the startup threshold for traditional string devices is a high 200-volt median.
The lower wake-up threshold allows the system to start delivering active power to the grid when the early morning illuminance is only 50 W/sqm, and the shutdown delay time at dusk is also extended by 45 minutes.
Over a 365-day statistical cycle, the cumulative daily increase of 1.5 hours of effective low-light generation time can push the entire system's annual equivalent full-load utilization hours up to 1350 hours.
Assuming the local average cloudy day probability is 25%, the independent tracking mechanism can recover 10% to 15% of power loss over a 25-year lifecycle.
For an 8 kW capacity system, calculated based on a base rate of $0.15/kWh, the extra 20,000 kWh generated will translate into $3,000 of pure monetary gain.
Crunching the Numbers
In the initial equipment procurement list, a string inverter with a nominal power of 5 kW is quoted at a median of around $1,500.
Configuring the same capacity system with 15 microinverters, each with a maximum output of 380 VA and a unit price of about $140, will drive the total hardware cost up to $2,100.
The extra $600 budget spent upfront seems to lower the static ROI, but by the 11th year of operation, the string device will reach its physical lifespan limit due to dried-out and aging electrolytic capacitors, necessitating a full unit replacement.
Microinverters internally use film capacitors that can withstand temperatures up to 105°C, with Mean Time Between Failures (MTBF) test data exceeding 2 million hours.
The full silicone potting process pushes its protection rating to NEMA 6 specifications, allowing full-load operation in extreme ambient temperature ranges from -40°C to 65°C.
The 25-year warranty commitment perfectly matches the 25-year degradation lifeline of monocrystalline solar panels, avoiding the mid-term $1,500 secondary replacement cost.
The AC trunk cable uses a 12 AWG three-core pure copper wire with a maximum safe ampacity of 20 amps. The voltage drop when the line extends to 30 meters is controlled below 1.5% of the nominal value, reducing Joule heating caused by line loss resistance.
Add Panels Anytime
In the 3rd year after the system is put into use, as the household adds an electric vehicle with a 75 kWh cell capacity, the original power supply load density will undergo a drastic change.
Under the traditional topology, the original 5 kW string inverter has already reached a 100% full-load state of its rated capacity.
If you want to add three 450-watt modules, you must scrap the old machine and spend another $1,800 to buy a 7 kW high-capacity inverter, causing a 30% sunk cost.
The parallel architecture of microinverters has an extremely high standard deviation tolerance, allowing you to freely mix and match photovoltaic panels of different brands, sizes, and 10% deviations in output parameters on the same 240-volt AC branch circuit.
By spending just $420 to purchase 3 new microinverter modules, plugging in the standard MC4 connectors, and leveraging the plug-and-play feature of the AC connectors, the system's total power can smoothly climb to 6.35 kW within a 30-minute installation cycle.
The built-in communication module in each device uploads operating data covering more than 20 dimensions—including DC voltage, temperature, and AC frequency—to the cloud server every 15 minutes via a 2.4 GHz wireless frequency.
Equipment Topology Type | Wake-up Voltage (V) | MPPT Algorithm Accuracy (%) | Factory Warranty (Years) | 15-Year Statistical Failure Rate (%) | Node Expansion Cost ($/kW) |
Traditional String | 200 | 98.5 | 10 - 12 | 18 | 350 |
Microinverter | 22 | 99.8 | 25 | 0.5 | 140 |
A statistical failure probability model based on the Poisson distribution shows that the probability of a single microinverter shutting down in the system is only two in a thousand.
Even if a single point of hardware damage occurs, the system capacity drop is strictly locked within the proportion of a single panel, such as a 6.6% negative impact from 1/15th of the array.
The remaining 93.4% installed capacity will continue to run at full speed with a 97.5% conversion efficiency, eliminating the extreme deviation of daily power generation dropping to zero caused by a total system paralysis.