How is solar energy renewable?
Solar energy originates from continuous internal nuclear fusion, with an expected lifespan of about 5 billion years, which is nearly infinite for humanity.
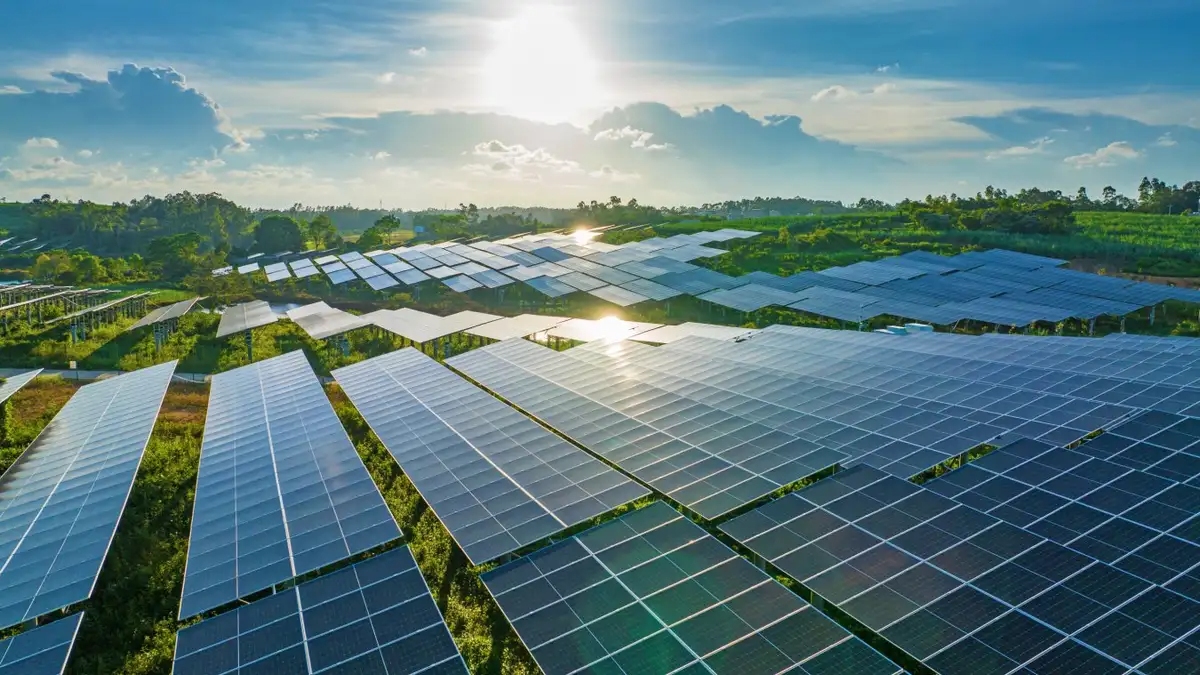
Studies show that the solar energy hitting the Earth every hour is enough to meet global electricity demand for a whole year.
It generates no greenhouse gases and has no risk of exhaustion. It is a recognized clean alternative in the scientific community that can help you achieve a low-carbon life and reduce long-term energy costs.

Source Longevity
Burns for a Long Time
The solar core currently converts 657 million tons of hydrogen atoms into 653 million tons of helium atoms every second through nuclear fusion reactions. The 4 million tons of mass lost in this process is converted into 3.846×10^26 watts of radiation power according to the mass-energy equation.
This star has currently consumed about 45.7% of its internal hydrogen fuel, and the remaining 54.3% of the fuel is enough to sustain the main sequence stage for another 5 billion years. This time span is more than 33 million times the known mining life of fossil energy for mankind (about 50 to 150 years).
The high temperature of 15,000,000 degrees Celsius and the pressure environment of 250 billion atmospheres inside the star ensure an extremely high stability of the energy release rate. Its total irradiance fluctuation rate has been lower than 0.1% over the past 1 billion years.
Of the energy released per second, about one 2.2 billionth hits the top of the Earth's atmosphere, which means receiving 1,361 watts of energy per square meter (solar constant).
This high-frequency and continuous energy injection constitutes the most fundamental "physical survival period" of renewable energy.
Plenty of Energy
Of the 174 petawatts (PW) of solar radiation at the top of the Earth's atmosphere, about 29% is reflected directly back into space by clouds and the atmosphere, 23% is absorbed by the atmosphere, and the remaining 89 petawatts finally reach the surface.
Even considering that the global land area only accounts for 29.2% and the average sunshine hours of different landforms (the global average is about 4.5 hours/day), the solar energy absorbed by land still reaches 440,000 exajoules (EJ) per year, which is more than 750 times the total energy demand of mankind of 580 EJ per year.
Photons cross the average sunshine distance of 149.6 million kilometers at a speed of 299,800 kilometers per second, taking only 8 minutes and 20 seconds to complete the energy transport. This instantaneous replenishment characteristic makes it physically impossible for solar energy to be exhausted in a 24-hour cycle.
Under a standard light intensity of 1,000 watts per square meter, one hectare of desert can receive more than 2 million kWh of radiation energy per year, and its energy abundance far exceeds the output power of any oil and gas field of the same area.
Stable Conversion
The highest conversion efficiency of current mainstream N-type TOPCon monocrystalline silicon cells in a laboratory environment has exceeded 26.89%, while the nominal efficiency of mass-produced modules generally falls in the 22.5% to 24.5% range.
For a single module size such as 2,384 mm × 1,303 mm, when the operating temperature is maintained at 45±2 degrees Celsius, its peak output power can reach 700 watts to 720 watts. This physical conversion process does not involve chemical chain breaking and only relies on the energy level transition of silicon atom outer electrons under a band gap width of 1.12 eV.
The linear power warranty adopted by industrial-grade photovoltaic systems usually covers the full cycle of 25 to 30 years, with the first-year degradation rate controlled within 1.0%, and the annual degradation rate in the subsequent 29 years being only between 0.4% and 0.55%.
This means that after 30 years of operation, the system can still maintain more than 87.4% of the initial rated capacity.
This extremely low hardware loss rate, combined with the stable supply of the sun for 5 billion years, establishes the asset certainty of distributed energy systems over a half-century dimension.
Extremely Fast Recovery
The energy input required to manufacture a 1 kW photovoltaic system, including the 1,400 degrees Celsius high-temperature energy consumption required for silicon purification and the electricity for module assembly, can usually be completely offset by its own power generation after 1.1 to 1.9 years of operation.
During the 30-year life cycle of the system, its "Energy Return on Investment (EROI)" is usually between 20:1 and 35:1, which is much higher than that of biomass energy (about 5:1) or some shale oil extraction (about 10:1).
The levelized cost of electricity (LCOE) of photovoltaic power generation has dropped by about 89% in the past 10 years.
The average cost in most parts of the world has now been reduced to 0.03 to 0.05 USD per kWh, lower than the 0.06 to 0.12 USD for coal-fired power generation.
The initial installation budget per kW of capacity is between 3,000 and 4,500 RMB. Combined with an average annual effective power generation time of 1,300 to 1,600 hours, its internal rate of return (IRR) is usually maintained in a stable range of 8% to 12%.
Carbon Footprint
Manufacturing Data
The carbon emissions of photovoltaic modules in the production stage are mainly concentrated in the silicon material purification process.
This process requires heating industrial silicon to a high temperature of 1,414 degrees Celsius, resulting in approximately 500 to 1,000 kg of CO2 equivalent for every 1 kW of photovoltaic system produced.
Nevertheless, according to the Intergovernmental Panel on Climate Change (IPCC), the full life cycle carbon emission intensity of photovoltaic power generation is only 12 to 48 gCO2e/kWh, while traditional coal-fired power generation emission intensity is as high as 820 to 1,050 gCO2e/kWh, and combined cycle gas turbine power generation is also between 430 and 490 gCO2e/kWh.
This means that at the same power generation level, the carbon intensity of solar energy is only about 5% of that of fossil energy.
Producing 1 kg of solar-grade polysilicon (purity needs to reach more than 99.9999%) consumes about 40 to 60 kWh of electricity. With the promotion of granular silicon technology, this energy consumption has decreased by about 30%.
In a standard bifacial double-glass module, glass weight accounts for about 70% and the aluminum frame accounts for about 15%. The production carbon footprint of these materials can be further reduced through large-scale recycling.
During the 25 to 30-year operation cycle, the amount of CO2 emissions offset by the photovoltaic system per kWh is enough to completely offset all carbon debts generated during its production, transportation, and installation processes within the first two years of operation.
Fast Payback
Energy Payback Time (EPBT) is an important quantitative index to measure the carbon footprint impact of photovoltaic systems.
In areas with sufficient sunshine resources (annual radiation of about 1,700 kWh/m2), the EPBT of polysilicon photovoltaic systems is usually between 0.7 and 1.2 years, and even in areas with weak sunshine (annual radiation of about 1,000 kWh/m2), the period will not exceed 2.1 years.
Considering that the nominal life of industrial-grade photovoltaic modules is 30 years, this means that during its life cycle, more than 93% of the time is spent generating zero-carbon "net benefit energy".
Important data citation:
The International Energy Agency (IEA) report points out that the average embodied carbon footprint per kW of installed capacity of current global mainstream N-type TOPCon cell modules has dropped from 1,200 kg five years ago to less than 750 kg today, a drop of 37.5%.
If a 1 megawatt (MW) photovoltaic system is deployed in an area with average light levels, its annual power generation is about 1.5 million kWh. According to the global average power carbon emission factor of 0.475 kg/kWh, the system can reduce 712.5 tons of CO2 emissions per year.
During the 30-year service period, the total emission reduction will reach 21,375 tons, which is more than 20 times its carbon emissions during the manufacturing stage.
Strong Emission Reduction
The greenhouse gas emissions of solar systems during the operation stage are 0, and since no combustion process is involved, the emission rates of nitrogen oxides, sulfur dioxide, and particulate matter (PM2.5) are also 0.
Compared with thermal power plants that consume about 300 grams of standard coal and emit about 2.6 grams of sulfur dioxide and 1.5 grams of nitrogen oxides per kWh, the contribution of photovoltaic power plants to air quality improvement has a quantitative advantage.
In terms of water resource utilization, the water consumption per MWh of photovoltaic power generation is less than 20 liters (mainly used for panel cleaning), while the amount of water dissipated through cooling towers by thermal power generation is as high as 1,500 to 2,800 liters/MWh. This water saving rate of more than 99% indirectly reduces the electricity consumption and associated carbon footprint of the water treatment process.
From the perspective of the carbon trading market, because photovoltaic power generation has clear carbon emission reduction attributes, 1 MW of photovoltaic assets can generate about 1,000 to 1,500 carbon sink units per year under some carbon credit systems.
If calculated at a price of 80 USD per ton of CO2, a large photovoltaic system can create additional economic benefits of 80,000 to 120,000 USD per year through carbon emission reduction.
This significantly improves the project's internal rate of return (IRR), giving it strong environmental asset attributes beyond pure financial returns.
True Value of Recycling
Currently, advanced physical and chemical recycling technologies can achieve 95% recycling of steel, aluminum, and glass, and about 90% recycling of semiconductor materials.
The aluminum obtained by recycling 1 ton of waste photovoltaic modules has a production energy consumption only 5% of that of electrolytic aluminum, and can reduce about 13 tons of CO2 emissions per ton.
The recycling of silicon wafers can avoid the high-temperature crystal pulling process again, saving more than 30% of electricity.
Important content citation:
According to statistics from the European Photovoltaic Cycle Association (PV CYCLE), the recycling cost of scrapped modules is currently about 150 to 200 USD per ton, but the market value of precious metals such as silver, copper, and silicon and high-purity materials extracted can often cover this expenditure and can further reduce the carbon footprint of the module's full life cycle by 10% to 15%.
Under the background that global photovoltaic installed capacity is expected to exceed 5 terawatts (TW) in 2030, an efficient recycling mechanism will support a secondary resource market with an output value of billions of dollars, while ensuring that the unit power carbon emission intensity of the photovoltaic industry maintains a continuous downward channel of 2% to 3% per year.
Environmental Bonus
In the multiple utilization of land resources, such as under the agriculture-photovoltaic or fishery-photovoltaic complementary modes, shading by photovoltaic panels can reduce surface water evaporation by 20% to 30% and enhance vegetation carbon sequestration capacity.
Although this synergy of ecological dimensions is difficult to fully quantify into a single carbon footprint index, it provides a positive bias in regional carbon neutral calculations.
Studies have shown that deploying photovoltaic arrays in semi-arid areas can increase the biomass growth rate of ground vegetation by 15% due to changes in local microclimates. This additional biological carbon sequestration further offsets the small amount of carbon emissions in the production of system brackets.
At present, the average Energy Yield Ratio of global photovoltaic modules has reached 30:1, that is, the energy generated during its life cycle is 30 times the energy required to produce the system.
With the commercialization of new technologies such as perovskite tandem cells, conversion efficiency is expected to break through the 30% mark, which will further increase energy output under the same carbon input by more than 20%.
ROI
Initial Capital Expenditure
Taking a standard 10 kilowatt (kW) residential system as an example, the current average installation unit price in the global market is between 1.5 and 2.5 USD per watt, which means the total budget usually falls in the range of 15,000 to 25,000 USD.
In terms of hardware breakdown costs, modules using N-type TOPCon technology account for about 25% to 35%, and their price per watt has currently dropped to 0.12 to 0.18 USD;
The inverter, as the core power conversion module, accounts for about 10% to 15%, and its cost per watt is between 0.08 and 0.15 USD.
The remaining 50% or more of the costs flow to the mounting systems, cables, distribution boxes, labor installation, and soft costs for obtaining grid connection permits.
This cost structure determines the importance of scale effects, that is, for every 1 kW increase in system capacity, its Balance of System (BOS) cost per unit usually drops by 3% to 5%.
Financial Data
Financial Indicator Item | Indicator Parameter/Value Range | Remarks |
Average Self-consumption Rate | 30% - 70% | Depends on storage and usage habits |
Grid Electricity Price Reference | $0.12 - $0.35 /kWh | Determines replacement income per kWh |
Annual Average Power Generation Hours | 1,200 - 1,800 hours | Fluctuates with latitude and weather |
First-year Return on Investment | 8% - 15% | Investment vs. first-year savings |
Internal Rate of Return (IRR) | 10% - 18% | 25-year full cycle compound return |
Static Payback Period | 5.5 - 8.2 years | Net period after tax credits/subsidies |
Detailed Calculation
The economic core of solar systems lies in the Levelized Cost of Electricity (LCOE), which is the total life cycle cost divided by total power generation.
In a 25-year operating cycle, considering an annual module power degradation of about 0.5% and the expected expenditure for replacing the inverter once around the 12th to 15th year (accounting for about 10% of the initial total budget), the LCOE of solar energy can usually be controlled between 0.04 and 0.07 USD per kWh.
Compared to the annual inflation rate of about 2% to 4% for grid retail electricity prices, photovoltaic power generation locks in a fixed energy cost for as long as 25 years.
Assuming a family consumes an average of 1,000 kWh per month at a price of 0.20 USD/kWh, after installing a 10 kW system, if the self-consumption rate reaches 60%, it can directly save about 1,440 USD in electricity expenses every year.
If the income from Net Metering is added, the annual net increase in cash flow can reach more than 2,000 USD.
After considering a 30% Investment Tax Credit (ITC), the net investment dropped from 20,000 USD to 14,000 USD, which directly shortened the static payback period by about 35%.
O&M Costs
The operating expenditure (OPEX) of photovoltaic assets is at an extremely low level among all energy forms, with average annual maintenance costs accounting for only 1% to 2% of initial capital expenditure.
Main expenditure points lie in panel cleaning, routine electrical inspections, and service fees for monitoring systems.
In dry and dusty areas, performing a professional cleaning every quarter (costing about 150 to 300 USD each time) can increase power generation efficiency by 8% to 15%. The ROI for this part of the investment usually exceeds 300%.
Long-term operation risks are mainly concentrated in hardware failure rates. Industrial data shows that the claim rate for first-tier brand modules within 25 years is less than 0.05%, while second-tier brands may reach more than 0.2%.
Inverter warranties are usually 10 years, and the cost of extending the warranty to 20 years is approximately 0.05 USD per watt.
If the system is equipped with power optimizers or micro-inverters, although the initial installation budget will increase by 15% to 20%, because they feature module-level monitoring and a warranty cycle of up to 25 years, they can reduce the overall 10% to 25% power loss caused by single-module shading. From a long-term Net Present Value (NPV) perspective, their return rate is often higher.
Asset Appreciation
According to real estate market research data, residential properties installed with photovoltaic systems have an average appraisal value about 4.1% higher than similar properties without installation at the time of sale.
For a house worth 500,000 USD, this means an asset appreciation of about 20,500 USD. In many cases, this appreciation has already covered or even exceeded the initial net installation budget of the system.
In addition, in some markets, Renewable Energy Credits (SRECs) or carbon credit trading provide holders with additional cash flow.
One credit is earned for every 1,000 kWh of green electricity generated, and its market price fluctuates between 10 and 40 USD.
For a system that produces 15,000 kWh of electricity per year, this means an extra 150 to 600 USD in non-operating income annually.
Lifespan Bill
When the system enters its 20th year of operation, although the module power has dropped to about 85% of the initial capacity due to linear degradation, the original investment has already been recovered at this time, and every kWh of electricity generated by the system can be regarded as "zero-cost" income.
At the 25-year mark, the Total Net Benefit of a photovoltaic system can usually reach 3 to 5 times the initial investment.
Even considering the potential module removal and recycling costs after 25 years (about 150 to 200 USD per ton), since the scrap recycling value of aluminum frames, copper cables, and high-purity silicon materials can offset about 40% of the removal labor costs, its impact on the overall internal rate of return (IRR) is less than 0.1 percentage point.