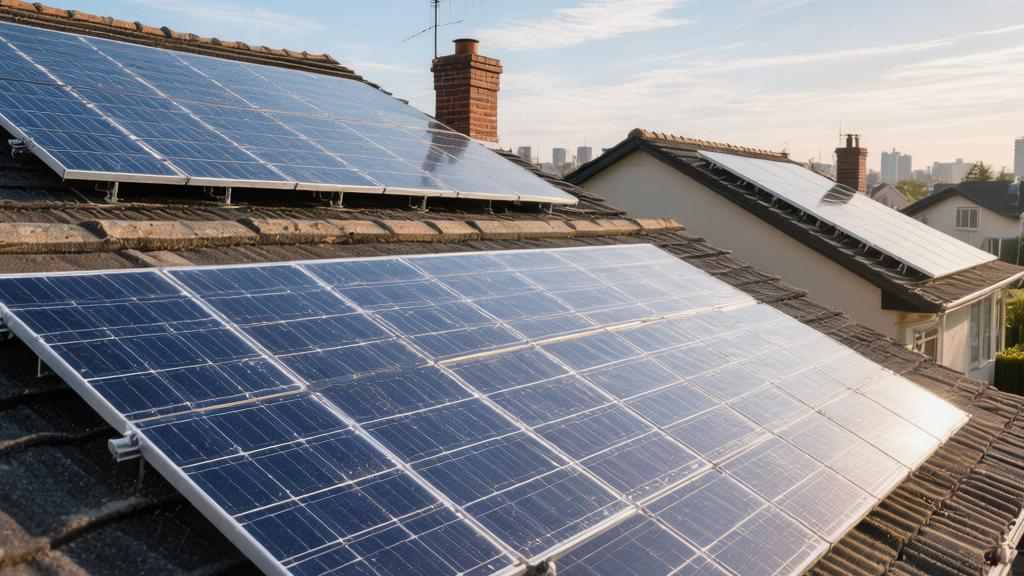
What are the positive and negative effects of solar panels?
The advantages of solar panels are that they are clean, renewable, and can reduce electricity bills.
For example, a 1 kW solar system can generate approximately 1,000–1,500 kWh of electricity per year, reducing about 0.7 tons of carbon dioxide emissions. Long-term use (with a lifespan of about 25 years) can save significant energy costs.
The disadvantages are the high upfront installation costs—typically ranging from 10,000 to 20,000 RMB for a home system. Furthermore, power generation is affected by weather and sunlight, with efficiency dropping significantly on rainy days or at night, and it requires a certain amount of roof space.
Financial Impact
Cost Breakdown
The cost of a residential solar system is usually calculated based on the installed capacity. In 2024, the average installation price in most markets is 1.4–3.0 USD/W.
The total budget for a 6 kW rooftop system is typically between 8400–18000 USD.
In terms of cost structure, module prices are approximately 0.20–0.35 USD/W, inverters are about 0.15–0.30 USD/W, mounting racks and cables are about 0.10–0.20 USD/W, and labor plus permitting costs are usually 0.60–1.20 USD/W.
If installing 18 units of 550W modules, the total power is approximately 9.9 kW DC capacity. The AC-side inverter is generally configured at around 8 kW, and the overall system efficiency is typically 96%–98%.
Based on a 9.9 kW module cost of about 2200–3500 USD, an inverter cost of 1200–2500 USD, and installation costs of 3000–7000 USD, the total cost is approximately 7000–13000 USD.
Permit fees vary significantly by region; in some cities, permit fees are about 200–600 USD, and grid connection inspection fees are about 100–400 USD.
Monthly Electricity Bills
For a 6 kW system in a city with 1700 hours of annual sunshine, the average annual power generation is approximately 7,800–9,000 kWh, with a daily average of 21–24 kWh.
If a household consumes 9,000 kWh annually, solar power can cover 85%–100% of the electricity demand.
At an electricity rate of 0.18 USD/kWh, the annual electricity bill reduction is approximately 1400–1620 USD.
If the electricity price rises to 0.25 USD/kWh, the savings for the same amount of power generation would be approximately 1950–2250 USD.
Assuming a system cost of 12000 USD and annual savings of 1600 USD, the payback period is approximately 7.5 years.
If the government provides a 25% installation subsidy, the actual expenditure drops to 9000 USD, shortening the payback period to 5.6 years.
In regions with higher electricity prices, such as 0.30 USD/kWh, the annual value of 9,000 kWh of generation is about 2700 USD, and the payback period could drop to 4–5 years.
Maintenance Costs
Modules are typically cleaned every 6–12 months. If dust density reaches 0.4–0.8 g/m², power generation efficiency drops by about 5%–10%.
Cleaning services generally cost 80–200 USD/time. If cleaned two times a year, the annual maintenance cost is about 160–400 USD.
Inverters usually have a lifespan of 10–15 years, with replacement costs of approximately 900–2200 USD.
Over a 25-year life cycle, most systems will require one inverter replacement.
The power degradation rate of modules is typically 0.4%–0.6%/year. Assuming the system generates 9,000 kWh in the first year, it will generate about 8,100 kWh in the 20th year, a reduction of about 10%.
The module failure rate is approximately 0.05%–0.1%/year. If 20 modules are installed, the average probability of damage per year is about 0.01–0.02 modules; statistically, it usually takes more than 15 years for a single failure to occur.
Return Cycle
Solar systems typically have a lifespan of 25–30 years. If the system has a cumulative 25-year generation of about 180000 kWh, calculated at an electricity price of 0.20 USD/kWh, the total value of the electricity is approximately 36000 USD.
After deducting 12000 USD in installation costs and 2000 USD in maintenance costs, the net profit is approximately 22000 USD. The average annual return on investment is about 6%–9%.
If electricity prices rise by 3% annually, the price could increase from 0.20 USD to about 0.42 USD/kWh after 25 years.
The cumulative value of the same 180000 kWh could reach 42000–48000 USD.
Under this scenario of rising electricity prices, net profit could reach 28000–32000 USD.
Solar generation costs can also be calculated per kWh. If the total system cost is 12000 USD and it generates 180000 kWh over 25 years, the average cost of generation is about 0.067 USD/kWh, which is 63%–78% lower than the 0.18–0.30 USD electricity rates in many cities.
Home Property Value
Real estate statistics from various regions show that homes with solar systems sell for an average of 3%–5% more.
For a home priced at 450,000 USD, the value increases by approximately 13500–22500 USD.
Assuming the home originally had a monthly electricity bill of 150 USD, after installing solar, the bill drops to 20–40 USD, reducing annual electricity expenditure by about 1320–1560 USD.
Over a 10-year ownership period, electricity costs are reduced by approximately 13200–15600 USD.
Some areas also allow for selling power back to the grid. If the excess generation is 2000 kWh/year and the grid buyback price is 0.08–0.12 USD/kWh, the additional annual income is about 1600–240 USD.
Over a 20-year cycle, this income accumulates to 3200–4800 USD.
Combining electricity savings, increased home value, and revenue from selling power, a 6 kW system typically brings a total economic value of 30000–50000 USD over a 20–25 year cycle.
Environmental & Sustainability
Emission Reduction
A 6 kW rooftop solar system generating 8,000–9,000 kWh per year can replace an equivalent amount of fossil fuel power generation.
The average global carbon emission intensity of electricity is approximately 0.45–0.55 kg CO2/kWh.
Using 0.5 kg/kWh as a baseline, an annual generation of 8,500 kWh can reduce about 4,250 kg of CO2 emissions.
Over a 25-year usage period, the total emission reduction is about 106 tons of CO2.
This value is equivalent to the emissions of a gasoline-powered car driving 420,000–460,000 km, as the average gasoline car emits approximately 0.23–0.25 kg CO2/km.
If a community has 1,000 sets of 6 kW systems, the total annual generation is about 8.5 million kWh, reducing emissions by about 4250 tons of CO2 per year, with a 25-year cumulative reduction of about 106000 tons.
Generating 8.5 million kWh at a coal-fired power plant typically requires burning about 3400 tons of coal. Coal emissions are about 2.5 tons of CO2/ton of coal, totaling about 8500 tons of CO2. Replacing this with solar systems can reduce 50%–60% of regional power emissions.
Material Usage
A 550W monocrystalline silicon solar module usually weighs 21–25 kg.
In terms of material structure, glass accounts for about 70%–75% of the weight, the aluminum frame about 10%–12%, silicon solar cells about 3%–5%, and encapsulation materials and backsheets about 8%–10%.
If 18 modules are installed, the total system weight is about 380–450 kg.
Of this, the glass weight is about 270–330 kg, the aluminum frame about 45–55 kg, and the silicon material about 15–20 kg.
The energy consumption to manufacture these modules averages about 1800–2200 kWh/kW of installed capacity.
For a 6 kW system capacity, the production process consumes approximately 10,800–13,200 kWh.
With an annual system generation of about 8,500 kWh, the energy payback period is approximately 1.3–1.6 years.
In other words, over a 25-year lifespan, the energy consumed during module production accounts for only about 5%–7% of the total energy generated.
Generation Comparison
Coal power generation emits an average of 820–1,050 g CO2/kWh, natural gas power about 350–500 g/kWh, while solar photovoltaic life-cycle emissions are typically 35–55 g/kWh.
If a household uses 9,000 kWh a year, the annual emissions from using coal power are about 7.4–9.4 tons of CO2.
Changing the same amount of electricity to solar power results in life-cycle emissions of about 0.32–0.50 tons of CO2. The difference between the two is more than 7 tons/year.
Over a 25-year cycle, the cumulative emission gap for one household is about 175 tons of CO2.
If a city has 200,000 households installing 5 kW systems, the total installed capacity is approximately 1 GW.
The annual power generation is about 1.3 billion kWh, equivalent to a reduction of 650,000 tons of CO2 emissions.
This value is close to the annual emissions of 140,000 gasoline vehicles, as an average vehicle emits about 4.6 tons of CO2 per year.
Temperature Changes
When a coal-fired power plant generates 1 kWh of electricity, it releases about 1.5–2.0 MJ of thermal energy into the environment, and its cooling system discharges large amounts of warm water.
A large thermal power plant's daily cooling water usage is typically 50,000–80,000 cubic meters.
If the same amount of electricity is provided by distributed 6 kW home systems, each system generating 8,500 kWh annually, it is equivalent to reducing approximately 12750–17000 MJ of heat emissions.
At the same time, it significantly reduces water consumption. Coal-fired power plants use an average of 1.8–2.5 liters of water per kWh.
If a home solar system generates 8,500 kWh a year, it can reduce water resource consumption by about 15300–21250 liters.
Over a 25-year cycle, the total water savings are about 380,000–530,000 liters, equivalent to the volume of 15–21 standard family swimming pools.
Resource Recycling
Current photovoltaic module recycling technology can recover 85%–95% of the material weight.
The recycling rate for glass is about 95%, aluminum frames about 98%, and silicon materials about 80%–90%.
After recycling a 23 kg module, approximately 21 kg of materials can be reused.
If a 6 kW system contains 18 modules, the total weight is about 410 kg, and the recycled material is about 350–380 kg.
Based on current recycled material prices, the recovery value is approximately 400–700 USD/system.
The global volume of decommissioned PV modules is expected to reach approximately 2 million tons by 2035 and may exceed 60 million tons by 2050.
If calculated based on a 90% material recovery rate, about 54 million tons of materials can be recovered.
Reusing these materials can reduce the amount of ore mining; for example, reducing the demand for aluminum ore by about 6 million tons and glass raw materials by about 35 million tons.
Reliability and Practicality
Is it Stable
The operational stability of a solar system is usually expressed by availability. Most residential system availabilities are between 97%–99%.
Assuming a 6 kW system has a theoretical annual generation of 9,000 kWh, calculated at a 98% system availability, the actual generation is about 8,820 kWh.
Factors affecting stable operation mainly include module failure rates, inverter failure rates, line losses, environmental shading, and dust coverage.
The average annual failure probability of a module is typically 0.05%–0.1%.
If 20 modules are installed, the statistical probability of a failure occurring each year is about 0.01–0.02 modules; most systems may only require a module replacement after 10 years or more.
The inverter is the module with the highest failure probability in the system, with an average lifespan of 10–15 years and a reliability of about 96%–98%.
Assuming the system runs for 25 years, one inverter replacement is typically required.
If the inverter has a rated power of 6 kW and a conversion efficiency of 96%–98%, when the modules output 6 kW of DC power, the AC output is about 5.76–5.88 kW.
In high-temperature environments, when the inverter temperature reaches 45–50°C, the conversion efficiency may drop by 1%–2%.
System line losses are typically 1%–3%. For example, if the module outputs 9,000 kWh, after passing through the inverter and lines, the final usable power is about 8,730–8,910 kWh.
Such losses are usually calculated during the system design phase. For instance, with cable lengths of 15–25 meters and a cable cross-section of 4–6 mm², the resistance loss is usually within 1%.
Weather Impact
Under sunny conditions, the solar irradiance intensity is usually 800–1,000 W/m², and the modules can reach 90%–100% of their rated power.
If the module's rated power is 550 W, the output on a sunny day is about 495–550 W.
Clouds reduce irradiance. When irradiance drops to 300 W/m², the module output power usually drops to 30%–40% of the rated power.
The same 550W module outputs about 165–220W.
In completely overcast or rainy weather, the irradiance intensity may be lower than 150 W/m², and the output power is about 10%–20% of the rated power.
The standard test temperature for PV modules is 25°C.
When the module temperature rises to 45°C, power usually decreases by 8%–10%.
If the module temperature reaches 60°C, power decreases by about 15%.
Power generation stability varies greatly by region, for example:
Annual Sunshine Hours | Annual Generation (6 kW System) | Daily Average Generation | Annual Fluctuation Range |
2,100 hours | 9,500 kWh | 26 kWh | ±6% |
1800 hours | 8,500 kWh | 23 kWh | ±8% |
1500 hours | 7,200 kWh | 19 kWh | ±10% |
1,300 hours | 6,100 kWh | 17 kWh | ±12% |
If there are five consecutive rainy days, the system's power generation may drop to 25%–40% of normal levels.
Assuming a typical daily generation of 24 kWh, it may only be 6–10 kWh during rainy weather.
Power Outages
Most home solar systems are grid-tied systems, which automatically stop outputting when the grid fails.
The reason is to prevent power from flowing back into the grid, protecting the safety of maintenance personnel.
During a power outage, without cell storage, a home still cannot use solar power even if there are solar modules on the roof.
Common household storage capacities are 10–15 kWh.
If a household's average daily consumption is 20 kWh, a 13 kWh cell can provide about 60% of the daily electricity demand.
The cycle life of cell systems is typically 4000–6000 cycles.
If charged and discharged once a day, the usage cycle is about 10–15 years.
Cell efficiency is about 90%–94%. For example, if 10 kWh is stored during the day, the usable power at night is about 9–9.4 kWh.
Storage system costs are typically 700–1100 USD/kWh.
The cost of installing a 13kWh cell is approximately 9000–14000 USD.
This configuration can provide 6–12 hours of home power during an outage, depending on the load power.
If the average home load is 800 W, a 13 kWh capacity cell can supply power for about 16 hours.
If the load increases to 2 kW, the supply time is about 6 hours.
Rooftop Conditions
The load-bearing capacity of a typical residential roof is usually 60–120 kg/m².
A single module weighs 21–25 kg and has an area of about 2.4 m², resulting in an average weight density of approximately 9–11 kg/m².
If 20 modules are installed, the total weight is about 420–500 kg, distributed over about 48 m² of roof area, with an average load of about 9–10 kg/m².
This load typically only accounts for 8%–15% of the roof's design load capacity.
Roof orientation and tilt also affect stable power generation.
Roof Direction | Annual Generation Change |
True South | 100% |
Southeast / Southwest | 92–96% |
True East / True West | 80–88% |
Northeast / Northwest | 65–75% |
Efficiency is usually highest when the tilt angle is between 25°–35°.
If the tilt is only 10°, annual generation usually decreases by 5%–8%.
If it exceeds 45°, power generation may decrease by 10%–15%.
If there is 20% area shading on the modules, the output power may drop by 30%–40%.
Modern systems use optimizers or micro-inverters to reduce this impact, controlling losses to 10%–15%.