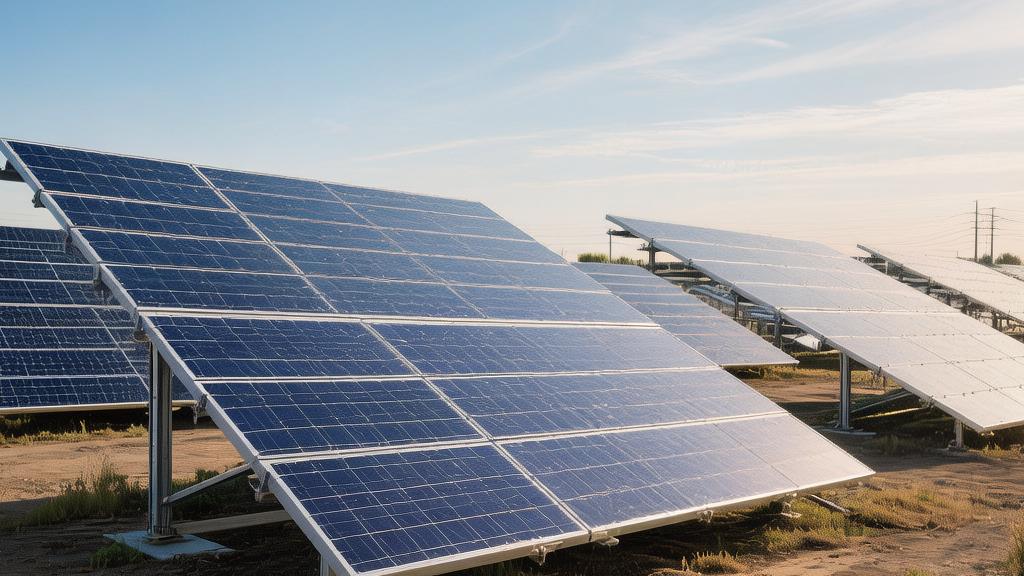
Do solar panels produce more energy than it takes to make them
Yes, solar panels are efficient net energy producers.
According to authoritative research from the International Energy Agency (IEA) and others, the Energy Payback Time (EPBT) is only 0.5 to 2 years, which is sufficient to offset all energy consumption from raw material extraction and manufacturing to transportation and installation.
Considering their typical lifespan is 25 to 30+ years, this means that the clean electricity produced over its lifetime is more than 20 times the energy invested.
Energy Payback Time
By 2026, the Energy Payback Time (EPBT) of a standard 450W monocrystalline silicon solar panel has been reduced to 0.9 to 1.2 years.
The initial energy investment to manufacture such modules is approximately 2900 MJ, while its 30-year rated lifespan can produce over 72,000 MJ of electricity.
Current N-type TopCon cell photoelectric conversion efficiencies generally reach over 25.5%, which increases the output current per square meter of panel by 15% under standard 1,000 W solar irradiance.
If the total energy consumption of silicon refinement, glass melting, and aluminum frame processing during the manufacturing process is converted into electricity, it is approximately between 550 and 620 kWh.
In an environment with a global average annual sunshine of 1600 hours, the system can generate 700 to 800 kWh of net electricity annually.
After deducting 1% for installation system losses, its Energy Return on Investment (EROI) reaches 25:1, meaning for every 1 Joule of manufacturing energy invested, the panel will feed back 25 Joules of green energy over its lifespan.
Energy Consumption
Producing high-purity polysilicon requires heating raw materials to over 1100°C, a process that accounts for 45% of the total energy consumption in cell manufacturing.
Refining each kg of 99.9999% purity electronic-grade silicon consumes approximately 48 to 52 kWh of electricity, while a 450W module typically requires about 600 grams of silicon material.
Solar ultra-white glass with a thickness of 3.2 mm requires 30 to 35 MJ/m² of energy in the melting furnace, accounting for about 9% of the total energy cost of the module.
For the 6063-type aluminum alloy frame used for reinforcement, the smelting energy consumption is as high as 13.5 MWh/ton, which averages out to about 45 to 50 MJ per individual module.
· The diameter of the diamond wire used in the cell cutting process has dropped to 35 microns, which has reduced silicon material loss by 20% and mechanical energy consumption by 5%.
· Silver paste consumption has dropped to below 80 mg per piece in 2026, leading to a 12% decrease in chemical energy consumption during the metallization stage.
· The lamination process runs at 150°C for 15 minutes, with the power consumption for a single module in this process being about 1.2 to 1.5 kWh.
· Packaging and transporting modules to an installation site 1,000 km away consumes fuel energy at a density of approximately 0.5 MJ/W.
Payback Speed
In high-latitude regions such as 50°N, where the average annual sunshine hours are about 900 to 1,000 hours, the energy payback period of the panels will extend to around 2.1 years.
However, near the equator or in arid zones at 20°S, where annual sunshine exceeds 2,200 hours, the payback period can be shortened to 0.75 years.
If the installation tilt angle deviates from the local latitude by more than 15°, the annual energy reception rate will drop by 4.5% to 7.2%, causing the payback time to be delayed by 2 months.
For every 1°C increase in ambient temperature, the output power of the module decreases by 0.35%. In high-temperature environments of 45°C, daily power generation will decrease by about 10%.
· Bifacial modules can increase additional power generation by 5% to 15% through reflected light on the back, accelerating the energy payback speed by 10%.
· Surface reflectivity (Albedo) has a significant impact on power generation efficiency; in snow-covered areas, reflectivity can reach 80%, while in grasslands it is only 20%.
· Although the tracking bracket system itself consumes 0.5% of the electricity, it can increase the energy capture rate by 25%, shortening the net payback period by 3 months.
· Dust accumulation in arid regions can lead to a 3% to 5% power drop per month; regular cleaning can maintain an energy recovery efficiency of 98%.
Efficiency Gains
HJT heterojunction cells mass-produced in 2026 have crossed the 26% efficiency threshold, 3 percentage points higher than the average five years ago.
Silicon wafer thickness has been reduced from 170 microns to 130 microns, directly saving 23% of the energy input in silicon material production.
After adopting SMBB (Super Multi-Busbar) technology, the shading area was reduced by 2.5%, increasing the short-circuit current of a single cell by 0.2 A.
Because the cell temperature coefficient was optimized from -0.39%/°C to -0.26%/°C, the cumulative annual power generation increased by 4% to 6% in actual outdoor high-temperature operation.
· Advanced passivation technology has reduced surface recombination losses by 1.5% and increased the open-circuit voltage value by 0.8%.
· The introduction of microcrystalline silicon technology has increased the inner wall reflectivity by 3%, enhancing the absorption probability of long-wavelength light.
· The new modules in 2026 have increased their power retention rate after 30 years from 80% to 87.5%, adding 2000 kWh to the total electricity yield.
· The full lifecycle degradation rate has dropped from 0.55% per year to 0.4%, meaning the panel produces 3% more energy in its 20th year than older models.
Environmental ROI
Carbon Footprint
80% of the carbon emissions from solar panel production are concentrated in the industrial upstream, particularly in the polysilicon refining stage.
In high-temperature furnaces at 1400°C, producing 1 kg of silicon material that meets purity standards emits about 50 to 60 kg of CO2.
With the popularization of granular silicon technology in 2026, production energy consumption has been reduced by 70%, bringing the carbon footprint per kg of silicon material down to below 20 kg.
Photovoltaic glass production is also a major emitter; every square meter of 3.2 mm thick glass releases about 15 kg of CO2 during the melting and rolling process.
The carbon intensity of aluminum frames depends on the energy source; if coal-fired power is used for aluminum smelting, emissions are as high as 15 tons per ton of aluminum, whereas using hydropower can reduce it to below 2 tons. This difference directly determines 10% of the initial environmental cost of the module.
· Carbon emission composition of 450W module production: Silicon refinement accounts for 45%, aluminum frame manufacturing 15%, glass production 12%, and cell assembly and logistics 28%.
· 2026 process optimization: After adopting 130-micron thin wafer technology, the carbon emission per watt is approximately 38% lower than the 2020 standard.
· Logistics environmental cost: The carbon emissions for shipping one standard container of modules across the ocean is about 1.2 tons, which, when allocated to a single panel, accounts for only 1.5% of total emissions.
Cleaner than Coal
Every MWh of coal-fired power generation requires about 2000 liters of water for cooling and dust removal, while solar panels consume almost zero water during their operational period, requiring only minimal amounts for cleaning.
In terms of air pollution, photovoltaic systems do not produce sulfur dioxide, nitrogen oxides, or PM2.5 particles during operation.
Thermal power plants typically emit about 300 tons of sulfur dioxide for every 1 billion kWh of electricity generated, while a photovoltaic power plant of the same scale can reduce such atmospheric pollutant emissions to 0.
This environmental benefit begins to exceed the total chemical emissions generated during its manufacturing phase in the 14th month of operation, achieving true ecological gain.
· Water resource savings rate: Compared to thermal power generation, a photovoltaic system can save about 45,000 liters of fresh water per kilowatt over its 30-year lifespan.
· Pollutant reduction: A 10 kW rooftop system can reduce emissions of nitrogen oxides by 45 kg and sulfur dioxide by 30 kg annually.
· Multiple land use: Agrivoltaic systems reduce surface evaporation by 20% to 30% through shading under the panels while generating power, improving irrigation efficiency by 15%.
Turning Waste into Treasure
Current mainstream physical disassembly and chemical treatment processes can recover more than 95% of silver, 90% of aluminum, and 85% of semiconductor materials from modules.
The energy saved by recycling 1 ton of waste photovoltaic modules is equivalent to the energy input for re-mining 1.2 tons of bauxite and 0.8 tons of quartz sand.
This closed-loop recycling mechanism reduces the environmental cost of the second life of photovoltaics by 75%.
· Material recovery value: Every ton of waste modules contains about 0.6 kg of silver and 150 kg of aluminum, with a recovery value of approximately 1,200 to 1,500 RMB.
· Energy consumption savings comparison: The energy consumption for recycling aluminum is only 5% of primary aluminum production, and the energy efficiency ratio for recycling silicon wafers is increased by 40%.
· 2026 recycling rate targets: The latest EU standards require that the mass recovery rate of photovoltaic modules must reach over 85%, and the material reuse rate must reach 80%.
Land Efficiency
In 2026, the installed capacity per hectare of large-scale ground power stations has increased from 0.5 MW five years ago to over 0.8 MW.
This means that for the same land area, energy output has increased by 60%, thereby reducing the land occupancy cost per unit of power generation.
For ecologically fragile areas, the bracket design of photovoltaic arrays is usually 2.5 meters or more above the ground, leaving space for vegetation growth and small animal migration.
Statistics show that for photovoltaic power plants built in semi-arid areas, the vegetation coverage under the panels increased by an average of 15% to 20% within three years. This "microclimate" effect is an additional ecological dividend that thermal or nuclear power plants cannot provide.
· Energy density: The area occupied per watt of N-type cell modules has dropped to 0.0045 square meters, a 12% increase in space utilization efficiency.
· Ecological restoration: Using photovoltaics in mining area restoration projects can shorten the green recovery period of damaged land from 10 years to 4 years.
· Wildlife compatibility: Inverters using low-noise frequency conversion technology reduce electromagnetic interference to below 30 decibels, minimizing the impact on migratory bird navigation.
Environmental Return
Based on 2026 carbon trading prices (approximately 85 EUR/ton), a 1 MW photovoltaic project creates over 80,000 EUR in carbon asset value annually through emission reductions.
Over a 30-year lifecycle, the system's net environmental return is typically 25 to 40 times its environmental input.
This high rate of return is reflected not only in carbon reduction but also in the protection of biodiversity and the curbing of heavy metal emissions.
In contrast, although nuclear energy has extremely low carbon emissions, the energy consumption of its back-end processing and the environmental monitoring requirements lasting tens of thousands of years make the calculation of its environmental ROI far more complex than that of photovoltaics.
· Full lifecycle carbon return: 1 unit of carbon emission invested in manufacturing yields 32 units of emission reduction credits.
· Environmental cost comparison: The environmental external cost of photovoltaics per kWh is about 0.02 RMB, while coal-fired power is as high as 0.15 to 0.25 RMB.
· Energy density gain: In 2026, high-efficiency bifacial modules under the same environmental cost have an annual electricity yield 15.5% higher than single-sided modules.
Factors That Influence the "Payback"
Where It Works Best
In arid zones at 20°S, the annual solar radiation per square meter on a horizontal plane is typically between 2200 and 2,500 kWh, allowing a 1 kW system to produce over 1800 kWh of electricity annually.
In contrast, in rainy regions at 50°N, the annual yield of the same system might be reduced to around 850 kWh.
The table below shows the direct impact of different irradiation levels on Energy Payback Time (EPBT):
Regional Irradiation Level | Annual Radiation (kWh/m²) | 1 kW System Annual Yield (kWh) | Energy Payback Time (Years) |
Extreme (e.g., Sahara/Australia) | > 2200 | 1850 - 2100 | 0.7 - 0.9 |
High (e.g., SW United States) | 1800 - 2200 | 1500 - 1800 | 0.9 - 1.2 |
Medium (e.g., Central Europe) | 1200 - 1600 | 1000 - 1350 | 1.3 - 1.8 |
Low (e.g., Northern Europe/London) | < 1000 | 750 - 950 | 2.0 - 2.6 |
If the annual sunshine hours at the installation site increase by 10%, the energy payback speed usually increases linearly by 9.5%.
Altitude also has an impact; for every 1,000 meters of elevation gain, the increase in atmospheric transparency results in a UV intensity increase of about 10% to 12%, which can bring an additional 3% current gain to the modules.
However, high-altitude areas are often accompanied by lower ambient temperatures; while this increases the open-circuit voltage, it also places higher requirements on the wind pressure resistance of the system brackets, increasing initial energy investment costs by about 5%.
Hardware Efficiency
Although the vacuum coating process in the production of mainstream 2026 HJT (heterojunction) cells consumes 15% more electricity than PERC technology, its 26.5% photoelectric conversion efficiency and lower temperature coefficient result in a 12% to 18% higher total power generation over a 30-year lifespan.
Currently, the thickness of monocrystalline silicon wafers on the market has been thinned to 130 microns, which saves about 24% of silicon material energy costs compared to the 170-micron specification in 2022.
· TopCon Cells: Conversion efficiency 25% - 26%, manufacturing energy consumption about 1.1 kWh/W, energy return ratio 22:1.
· HJT Cells: Conversion efficiency 26% - 27.5%, manufacturing energy consumption about 1.3 kWh/W, energy return ratio 24:1.
· Perovskite Tandem: Conversion efficiency above 29%, theoretical manufacturing energy consumption is lower, but current lifespan is only 15 years, affecting long-term returns.
· Bifaciality: Modern modules' backsides can contribute 5% to 25% additional power, depending on the ground albedo.
Although modules using dual-glass encapsulation technology have a 15% weight increase, which raises carbon emissions in the transportation phase by about 3%, their water resistance rate is improved 100-fold, extending the effective lifespan of the modules from 25 years to 35 years.
This extension of lifespan means that after "repaying" the initial 1 year of manufacturing energy, the panel has an extra 10 years of pure green energy production.
Current high-quality modules have an annual degradation rate controlled within 0.35%, meaning they still maintain 89.5% of their initial output power in the 30th year.
Is the Angle Correct
The impact of geometric parameters during installation on energy acquisition is often underestimated; for every 10 degrees the tilt angle deviates from the optimal, the annual power generation loss is about 3.5%.
If a fixed bracket system is used and the orientation deviates from true south (Northern Hemisphere) by more than 30 degrees, the energy payback period will be extended by 4 to 6 months.
Power plants using single-axis tracking systems, although the brackets themselves add about 15% more steel and 0.5% in motor operation electricity consumption, can increase full-day energy capture by 20% to 30%.
Installation Type | Extra Energy Input (Relative to Fixed) | Annual Generation Gain | Impact on Comprehensive Payback Cycle |
Fixed (Optimal Tilt) | 0% | Baseline | 1.2 Years |
Seasonally Adjustable Bracket | +3% | +5% - 8% | 1.15 Years |
Single-Axis Tracking System | +12% | +20% - 30% | 0.95 Years |
Dual-Axis Tracking System | +25% | +35% - 45% | 1.05 Years |
Shade is the "killer" of energy output; even if only 5% of the panel area is shaded by utility poles or trees, the intervention of bypass diodes can cause the power of the entire string to drop by 20% to 30%.
By 2026, the popularization of Module Level Power Electronics (MLPE) has solved this problem. Although it adds about 0.15 RMB per watt in cost and 1% in self-consumption, it can recover more than 15% of power loss in complex shade environments.